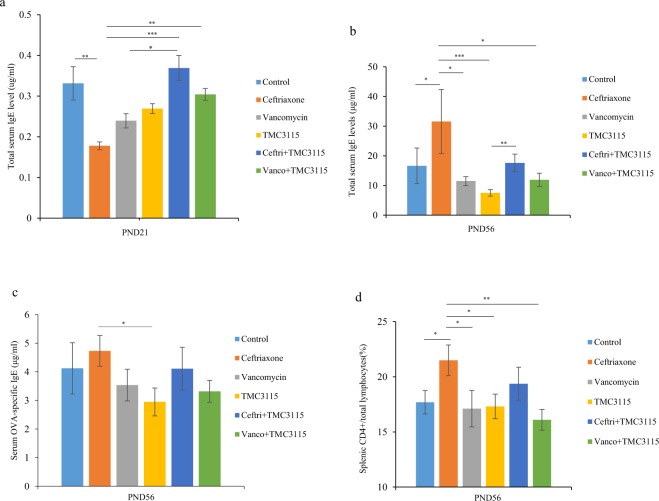
Figure 5.
Immune response of mice at different stages. (a) Serum total IgE levels of mice at PND 21 (n = 6/group). μg: microgram, ml: milliliter. (b) Serum total IgE levels of mice at PND56 (n = 12/group). (c) Serum OVA-specific IgE of mice at PND56 (n = 12/group). (d) The percentage of the CD4+ T cells/lymphocytes in spleen are shown (n = 12/group). pg: picogram. The two ends of the horizontal line represent the two compared groups, the asterisk on the line represents significant difference between groups, *p < 0.05, **p < 0.01, ***p < 0.001, for intergroup comparisons. TMC3115, Bifidobacterium bifidum TMC3115; Ceftri, Ceftriaxone; Vanco, Vancomycin. PND, postnatal day.

