Figure 2.
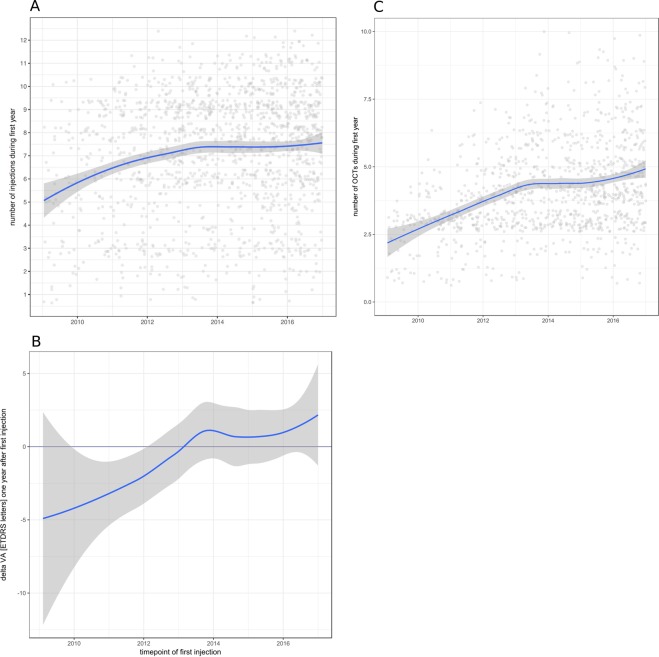
Development of injection frequencies and VA outcomes over time. (A) The number of injections in the first year of treatment increased over time. Eyes with their first injection in 2009 received a mean of 5 to 6 injections (median 5). Eyes with treatment initiated after 2013 received a mean of 7.5 injections (median 8) and PRN injection frequencies did not increase further. Graph shows mean injection numbers in blue with 95% confidence interval in grey. Individual eyes are represented by light grey dots. x-axis represents year of first treatment. (B) Mean visual acuity at the end of the first treatment year shows a decrease of up to five letters for eyes treated between 2009 and 2013. Eyes treated from 2013 onwards gained on average 0 to 2 letters. Graph shows mean VA acuity change in blue with 95% confidence interval in grey. Individual eyes are represented by light grey dots. x-axis represents year of first treatment. (C) Mean number of OCT exams performed in the first treatment year increases over the years mirroring the increase in injection numbers and VA. Graph shows mean number of OCT exams in blue with 95% confidence interval in grey. Individual eyes are represented by light grey dots. x-axis represents year of first treatment. Y-axis is cut at 10 for better visualization; 11 eyes had more than 10 OCTs in the first year (max. 18).

