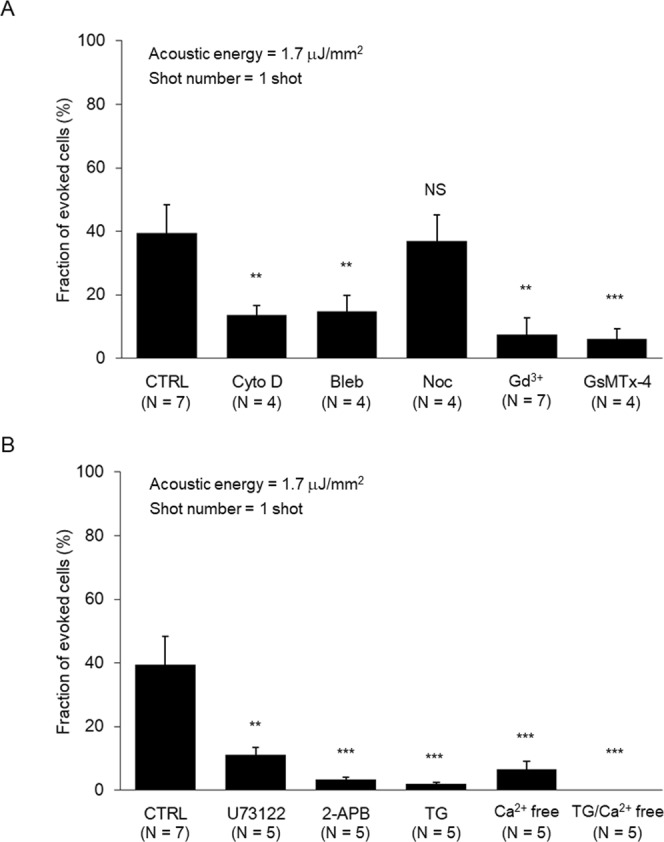
Figure 4.

Subcellular structure and Ca2+ cascades involved in the intracellular Ca2+ increase. (A) Inhibitions by CytoD and Bleb show the involvement of actin cytoskeletons. Inhibitions by Gd3+ and GsMTx-4 show the involvement of SA channels. (B) Inhibition by U73122, 2-APB, and TG show the involvement of Ca2+ release via the PLC-IP3-IP3R cascade. Inhibition by depleting extracellular Ca2+ with Ca2+-free solution show the involvement of Ca2+ influx.
