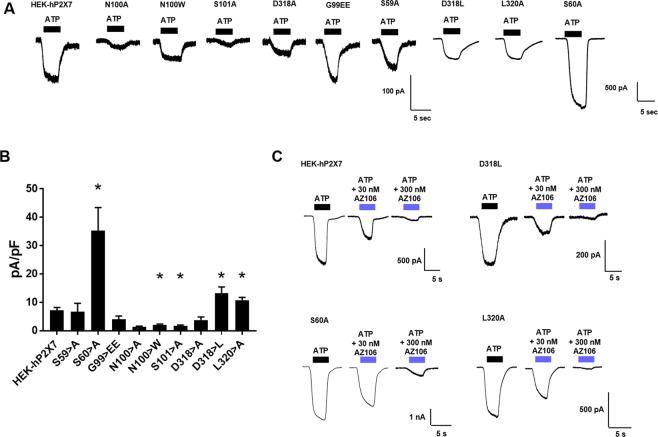
Figure 4.
Patch clamp analysis reveals altered agonist responses in D318L, L320A and S60A mutants. Whole cell patch clamp recordings were performed at room temperature. Cells were voltage-clamped at −60 mV and responses to 5 second application of ATP (100 µM) measured from HEK-293 cells stably expressing WT or mutant hP2X7. (A) Representative traces are shown for ATP responses (B) Summary of normalised current amplitudes expressed as pA/pF (n = 5–25 cells). (C) Inhibition by AZ10606120 (30 nM, 300 nM) was tested in cells expressing D318L, S60A and L320A hP2X7 mutants and compared to WT hP2X7. An initial response to ATP was measured and then AZ10606120 applied to the cell for 1 minute followed by ATP in the presence of AZ10606120. Traces are representative of 3–5 cells.

