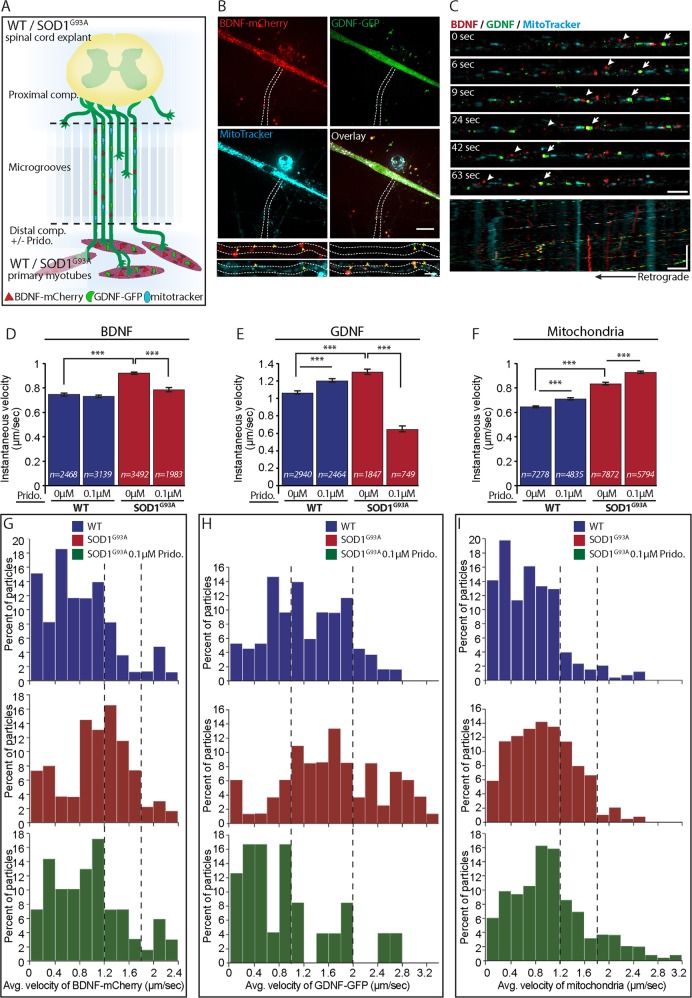
Fig. 4. Locally administered Pridopidine regulates the axonal transport of BDNF, GDNF, and mitochondria in co-culture of SOD1G93A.
a Schematic illustration of the experimental procedure. Primary skeletal myoblasts expressing BDNF-mCherry and GDNF-GFP are co-cultured with ventral spinal cord explants from WT or SOD1G93A E12.5 mouse embryos. Pridopidine is exclusively applied at this phase to the distal compartment. At 7 days in co-culture, the axonal transport of muscle-derived BDNF-mCherry and GDNF-GFP, as well as the transport of mitochondria is imaged. b Representative confocal images of myocyte in the distal compartment expressing both BDNF-mCherry (red) and GDNF-GFP (green) and stained with MitoTracker (cyan). The white dashed line denotes an axon innervating a muscle containing BDNF-mCherry and GDNF-GFP particles as well as mitochondria. Scale bar: 20 µm. Lower panel includes magnified images of the axon. Yellow arrowheads denote the BDNF, GDNF, and mitochondria within the axon. Scale bar: 5 µm. c Representative time-lapse images show the retrograde axonal transport of muscle-derived BDNF-mCheery (red), GDNF-GFP (green), as well as the retrograde transport of mitochondria (cyan). White arrows denote co-transported BDNF-mCherry and GDNF-GFP. The arrowhead denotes co-transported BDNF-mCherry and mitochondria. Scale bar: 5 µm. Lower panel includes a kymograph of the entire time lapse movie demonstrating that most of the BDNF and GDNF, as well as mitochondria are retrogradely transported. Scale bars – horizontal: 5 µm vertical: 100 s. d–f Quantitative analysis of the instantaneous velocity of D) BDNF-mCherry, E) GDNF-GFP, and F) mitochondria from axons in co-culture of WT or SOD1G93A reveals accelerated axonal transport of all of the above in SOD1G93A compared to WT (n = number of particle steps). Application of 0.1 µM pridopidine exclusively to the distal compartment is sufficient to restore the axonal transport properties of BDNF-mCherry and GDNF-GFP. However, the retrograde mitochondrial transport is further accelerated in the pridopidine-treated cultures. g–i Stacked distribution plots of the average velocity of G) BDNF-mCherry, H) GDNF-GFP, and I) mitochondria display higher transport velocities for all of the above in SOD1G93A co-cultures. dashed lines highlight the changes in transporting populations of GDNF-GFP, BDNF-mCherry and mitochondria. Whereas 0.1 µM pridopidine moderates the velocities of BDNF-mCherry and GDNF-GFP, a specific population of mitochondria is transported even faster in response to the pridopidine treatment. Data are shown as the mean ± SEM. ***p value < 0.001 (n = 3 or more independent experiments; Student’s t test)

