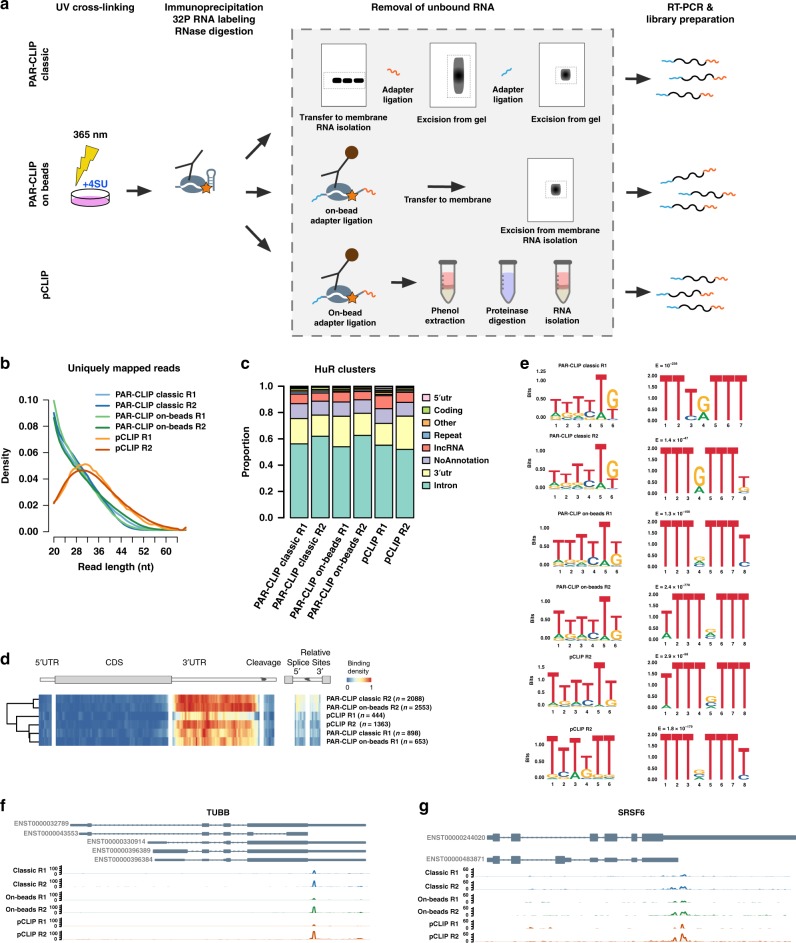
Fig. 4.
A fast PAR-CLIP variant employing phenolic extraction (pCLIP). a Schematic comparison of PAR-CLIP variants. b Read length distribution of uniquely mapping reads utilised for determine binding sites (cluster) of HuR (ELAVL1). PAR-CLIP samples were processed using PARpipe (see methods). c Relative proportion of PARalyzer-derived cluster annotation. d Heatmap of relative positional binding preference for intron-containing mRNA transcripts for each of the six HuR PAR-CLIP samples. Sample-specific binding preferences were averaged across selected transcripts (see methods). The relative spatial proportion of 5′UTR, coding regions and 3′UTR were averaged across all selected transcript isoforms. For TES (regions beyond transcription end site), 5′ splice site, and 3′ splice site, we chose fixed windows (250 nt for TES and 500 nt for splice sites). For each RBP, meta-coverage was scaled between 5′UTR to TES. The 5′ and 3′ intronic splice site coverage was scaled separately from other regions but relative to each other. e We applied de novo motif discovery for PARalyzer derived clusters using ZAGROS (left) and DREME (right). For Zagros, we found a T-rich motif scoring the highest in all cases. As ZAGROS does not return E-values we analysed the cluster sequences using DREME. For all but classic PAR-CLIP R2 we found a T-rich motif scoring the highest. For classic PAR-CLIP R2 however, the T-rich motif scored second with a similar E-value to a less frequent primary motif (Supplementary Fig. 16). f, g Genome browser shots of TUBB and SRSF6 example genes showing reproducible 3′UTR binding sites. Track y-axes represent uniquely mapping read count

