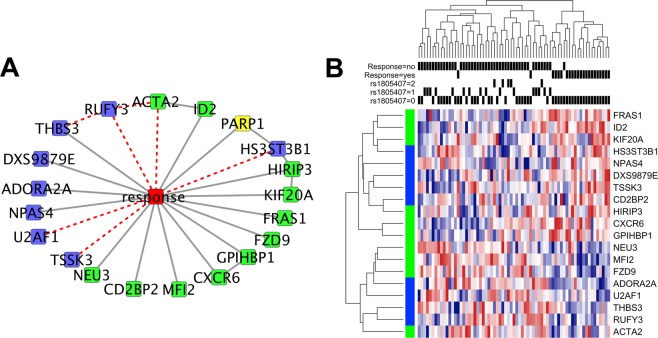
Figure 1.
Conditional Gaussian sub-network around response to treatment with edge filter (A). Blue nodes represent methylation probes, green nodes represent mRNA expression probes and yellow nodes represent SNPs. Dashed red lines indicated edges removed by filtering step. Heatmap of variables directly connected to response to TMZ treatment (B). Black bars show rs1805407 status and response to treatment. Rows marked with green on the left are mRNA expression profiles and those marked with blue are methylation profiles.

