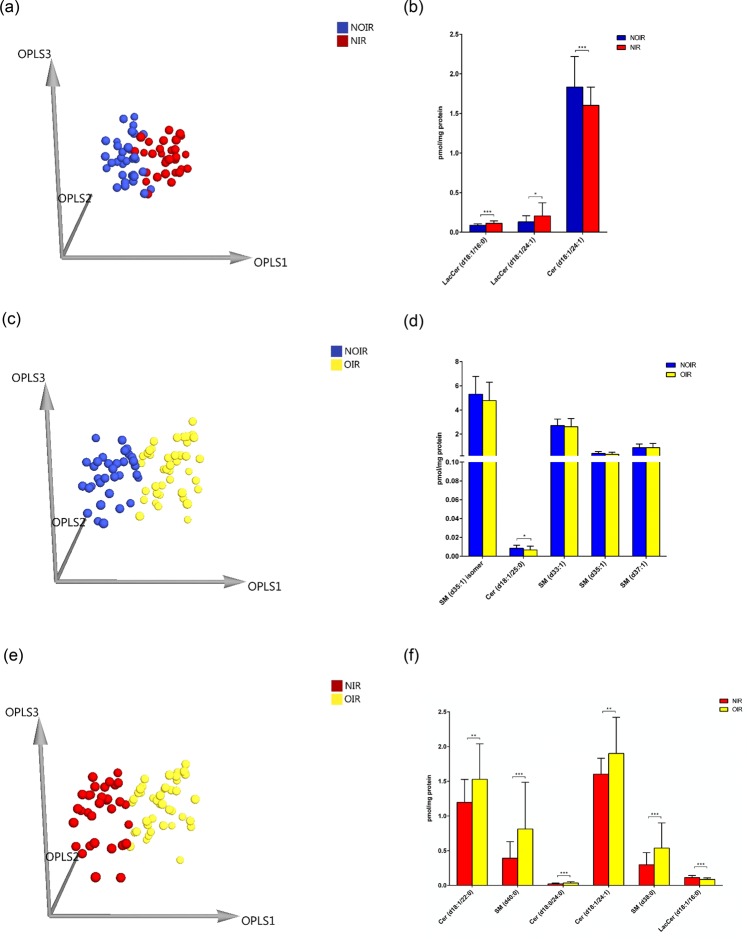
Figure 4.
(a) The 3D OPLS-DA score plot for NOIR patients (n = 34) and NIR patients (n = 32) (R2X = 0.499, R2Y = 0.691, Q2 = 0.301). (b) The potential markers (LacCer (d18:1/16:0), LacCer (d18:1/24:1), and Cer (d18:1/24:1)) for the classification between NOIR patients and NIR patients. Each column represents the mean ± SD. *p < 0.05, ***p < 0.001. (c) The 3D OPLS-DA score plot for NOIR patients (n = 34) and OIR patients (n = 41) (R2X = 0.481, R2Y = 0.415, Q2 = 0.113). (d) The potential marker (Cer (d18:1/25:0)) for the classification between NOIR patients and OIR patients. The columns represent the mean ± SD. *p < 0.05. (e) The 3D OPLS-DA score plot for NIR patients (n = 32) and OIR patients (n = 41) (R2X = 0.516, R2Y = 0.534, Q2 = 0.416). (f) The potential markers (Cer (d18:1/22:0), SM (d40:0), Cer (d18:0/24:0), Cer (d18:1/24:1), SM (d38:0), and LacCer (d18:1/16:0)) for the classification between NIR patients and OIR patients. Each column represents the mean ± SD. **p < 0.01, ***p < 0.001.

