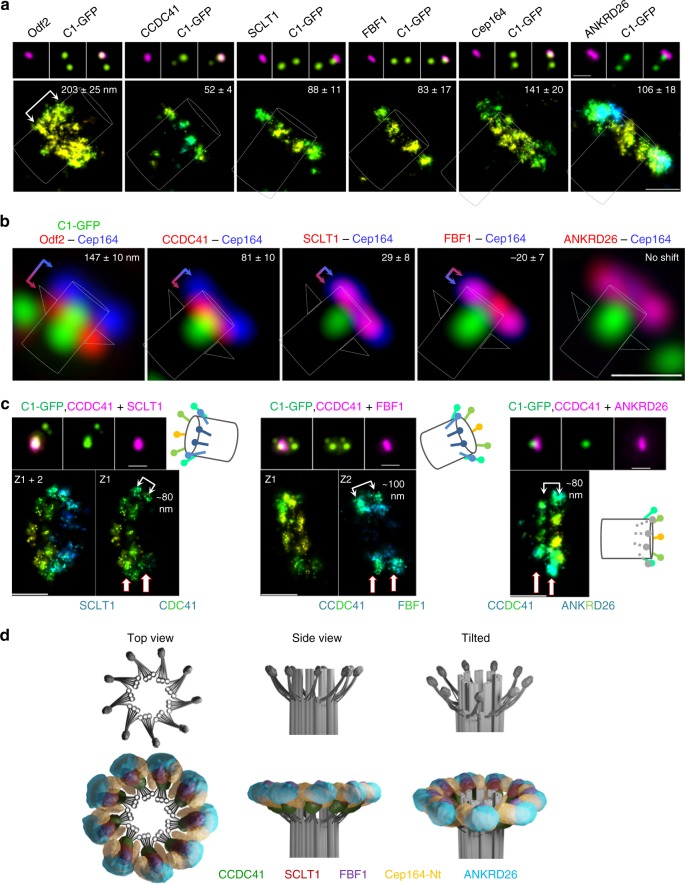
Fig. 4.
Longitudinal distribution of distal appendage proteins. a A comparative wide-field and 3D STORM analysis of the SDA component Odf2 and various DAPs on longitudinally-oriented older mother centrioles in interphase. The average ± s.d. thickness of the signals is noted. n = 11 centrioles for Odf2, 10 for CCDC41, 22 for SCLT1, 16 for FBF1, 26 for Cep164, and 10 for ANKRD26. b Two-color SIM images illustrating the lateral shift between the DAPs. The average ± s.d. distance between centers of each signal’s intensity peaks is indicated. CCDC41 signal localizes most distally, while SCLT1 almost colocalizes with Cep164. FBF1 signal appears slightly shifter towards the distal end. ANKRD26 and Cep164 colocalize. n = 8 centrioles for Odf2, 11 for CCDC41, 17 for SCLT1, 15 for FBF1 and 10 for ANKRD26. c Two-protein STORM analysis of longitudinally-oriented centrioles showing that CCDC41 and FBF1 are laterally shifted for ~100 nm, and CCDC41 and SCLT1 and CCDC41 and ANKRD26 for ~80 nm, corroborating values obtained in (b) by SIM. d A 3D model illustrating the organization of DAs electron densities, and the localization of the DAPs with respect to the electron densities. Scale bars: 1 μm for all wide-field images of centrioles and 200 nm for STORM images

