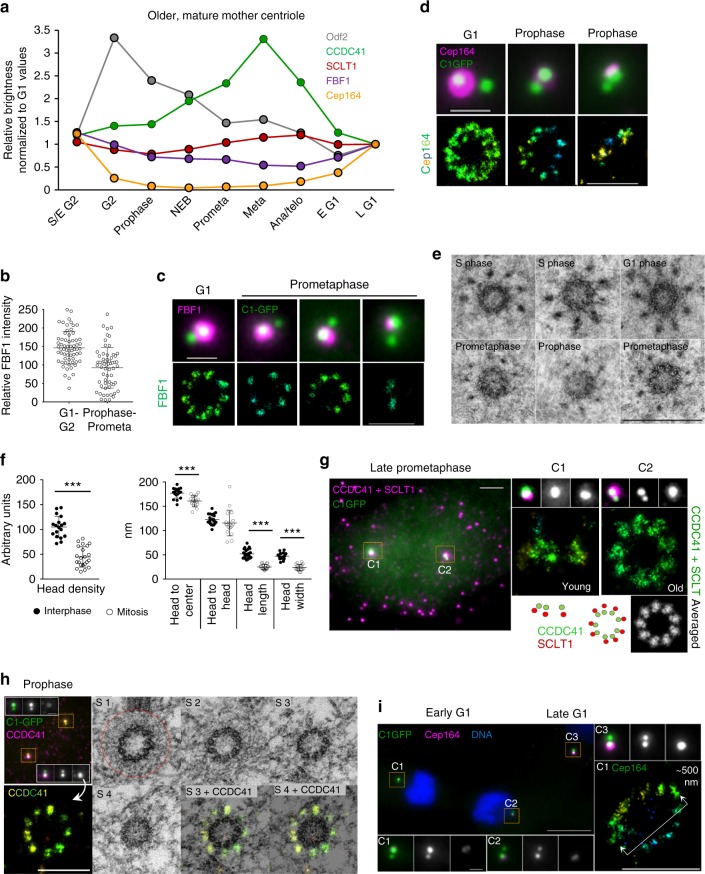
Fig. 6.
Distal appendages of mature centrioles remodel before mitosis. a Average levels of the DAPs and Odf2 associated with older mother centrioles in cycling RPE-1 during the cell cycle. n = 217 cells for Cep164, 135 for CCDC41, 155 for SCLT1, 176 for FBF1, 244 for Odf2. Box-and-whisker plots of the same dataset are presented in Supplementary Figure 5. Representative results from a single dataset; the quantification was performed several times with similar results (3x for Cep164 and FBF1, 2x for SCLT1, CCDC41 and Odf2). b Intensity of FBF1 signals is variable on older mother centrioles in mitosis. A median line and upper and lower quartile are marked in dot-plots, n = 63/61 for interphase/mitotic centrioles. c Decreased FBF1 intensity in prometaphase correlates with reduced number of STORM foci. d The typical interphase loop-like organization of Cep164 is no longer detectable on older mother centrioles in mitosis. e Comparison of the DA EM densities of interphase and mitotic cells. One 80 nm section is shown for each centriole. f Quantification of DA’s EM densities from interphase and mitotic centrioles. A median line and upper and lower quartile are marked in dot-plots, n = 5 centrioles for mitotic and n = 7 for interphase samples.***P < 0.001. g Left panel: wide-field image of prometaphase RPE-1 cell immunolabeled for CCDC41 and SCLT1 in one color (magenta). The same cell was analyzed by STORM (right panel). h Correlative STORM/EM analysis of older mother centriole’s CCDC41 in prophase. Left: wide-field image of a prophase RPE-1 cell immunolabeled for CCDC41 and analyzed by STORM. Each mother centriole (containing brighter C1-GFP) is associated with a daughter centriole (adjacent dimmer C1-GFP). Right: Correlative EM analysis of the same older mother centriole from left panel. CCDC41 is localized to nine discrete signals, but DAs and SDAs densities are no longer detectable. The PCM is outlined by red circle. This panel is associated with Supplementary Figure 2. i Two sister cells in early G1, at the stage of Cep164 re-accumulation to the mother centrioles (C1 and C2). STORM shows the lack of Cep164 arrangement typical for late G1 and S phase (compare to Fig. 2). Scale bars: wide-field images of centrioles, 1 μm; wide-field image in (g) 2 μm; STORM images, 500 nm in (d, c, i); 200 nm in (g); 400 nm in (h); 500 nm in (e). The source data underlying Figure 6a is provided as a Source Data file

