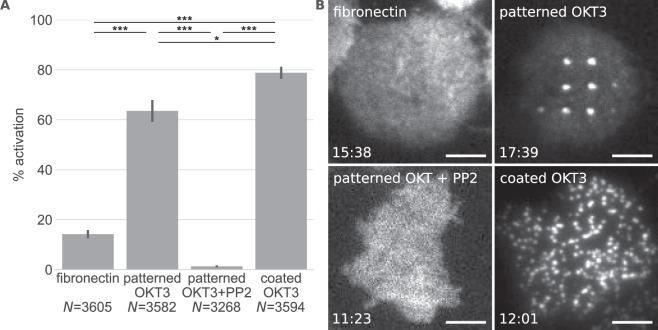
Figure 2.
Jurkat T cell activation on the different surfaces. (A) Mean percentage of activated cells measured via the increase of intracellular Ca2+ levels (*P < 0.05 and ***P < 0.005 (two-tailed unpaired t-test)). Error bars show the SEM in 3 or more different experiments. N indicates the total number of measured cells. (B) Representative images of ZAP70-GFP distribution in cells on the different surfaces. The timepoint after cell seeding is shown in the bottom left corner. Scale bar is 5 µm.

