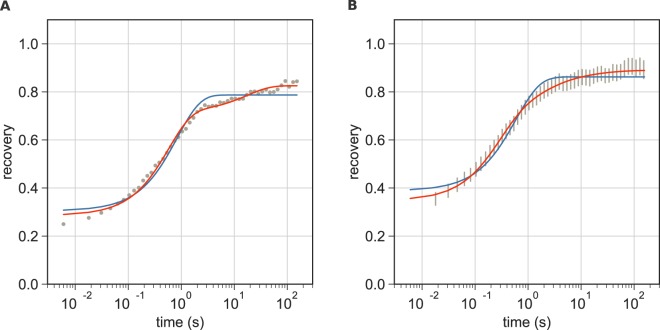
Figure 3.
FRAP on non-activated Jurkat T cells. (A) A representative FRAP curve of ZAP70-GFP measured in a cell seeded onto a fibronectin-coated surface. A bi-exponential fit (Eq. 2, shown in red) yielded τ1 = 0.57 s, τ2 = 17.4 s, fm = 0.83, b = 0.29 and c = 0.80. A mono-exponential fit (Eq. 1) is shown in blue as a reference. (B) Averaged FRAP curves of ZAP70-GFP measured in cells on a fibronectin-coated surface. Data are from three independent experiments with 17 different cells. The 95% confidence interval is shown. Mean values ± SE from cells fitted individually with Eq. 2 were: τ1 = 0.29 ± 0.03 s, τ2 = 12.6 ± 3.9 s, fm = 0.89 ± 0.02, b = 0.35 ± 0.01 and c = 0.67 ± 0.03. The average of all fit curves is shown in red.

