Figure 4.
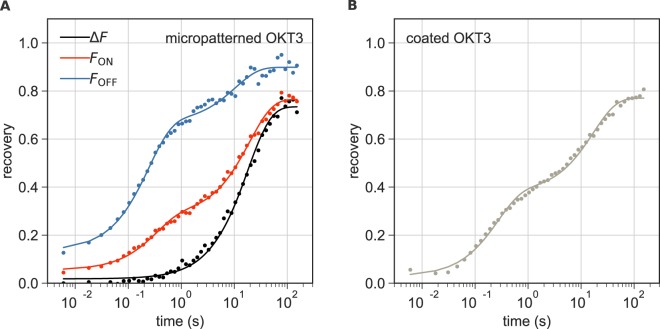
ZAP70-GFP recovery in cells on micropatterned and coated OKT3 surfaces. (A) Recovery of fluorescence over time in “ON” and “OFF” areas in a representative micropatterned cell is shown in red and blue, respectively. Fitting with Eq. 2 yielded τ1 = 0.2 s, τ2 = 10.5 s, fm = 0.90, b = 0.14 and c = 0.7 for the “OFF” curve and τ1 = 0.3 s, τ2 = 19.4 s, fm = 0.77, b = 0.05 and c = 0.32 for the “ON” curve. The relative recovery of fluorescence ΔF over time is shown in black and was fit with Eq. 1 yielding τ = 18.1 s, fm = 0.73, b = 0.02. (B) Recovery of fluorescence over time in a representative cell on a homogeneously coated OKT3 surface fitted with Eq. 2 yielding τ1 = 0.26 s, τ2 = 17.0 s, fm = 0.77, b = 0.03 and c = 0.47.

