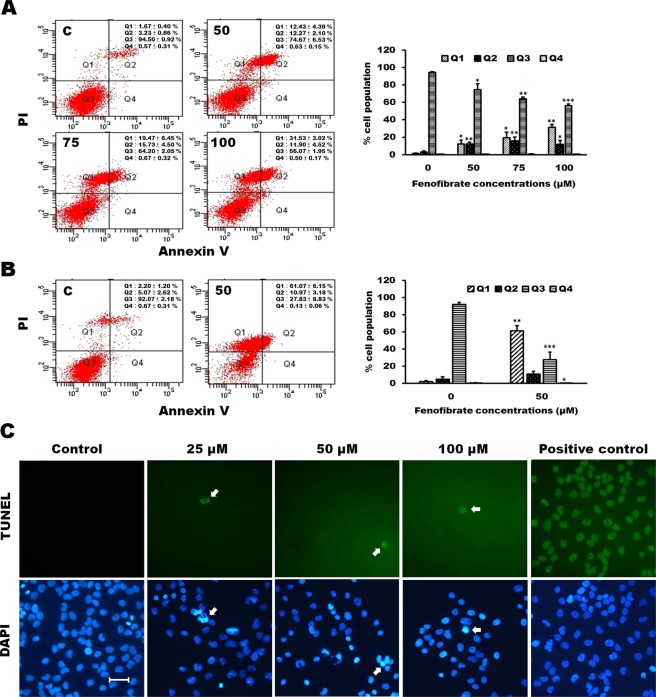
Figure 5.
Fenofibrate induced apoptosis and necroptosis of Hep3B cells. (A) Cells were incubated with 0.1% DMSO or with 50, 75 or 100 µM fenofibrate for 24 h. Cells were then stained with annexin V-FITC/PI and analyzed using flow cytometry. The cell population of Q3 area was regarded as control cells, whereas Q4 area were taken as a measure of early apoptosis, Q2 area as late apoptosis and Q1 area as necrosis. All results are representative of three independent experiments performed in duplicate. *P < 0.05, **P < 0.01, ***P < 0.001 compared to the control values. (B) Cells were incubated with 0.1% DMSO or 50 µM fenofibrate for 48 h and then processed for annexin V-FITC/PI staining. All results are representative of three independent experiments performed in duplicate. *P < 0.05, **P < 0.01, ***P < 0.001 compared to the control values. (C) The effect of fenofibrate on the nuclear morphology and DNA fragmentation in Hep3B cells. The nuclear morphology and DNA fragmentation of fenofibrate-sensitized Hep3B cells were evaluated by DAPI and TUNEL assay. Hep3B cells were cultured for 24 h with vehicle alone or with 25, 50 or 100 µM fenofibrate. Cells were stained with TUNEL and then stained with 1 μg/ml DAPI for 5 min at 37 °C. In positive control, Hep3B cells were incubated with 200 U/ml DNase I for 10 min after cell permeabilization and then stained with TUNEL. After three washings in PBS, the cells were examined by fluorescent microscope. Results are representative of three independent experiments performed in triplicate. Bar = 25 μm.

