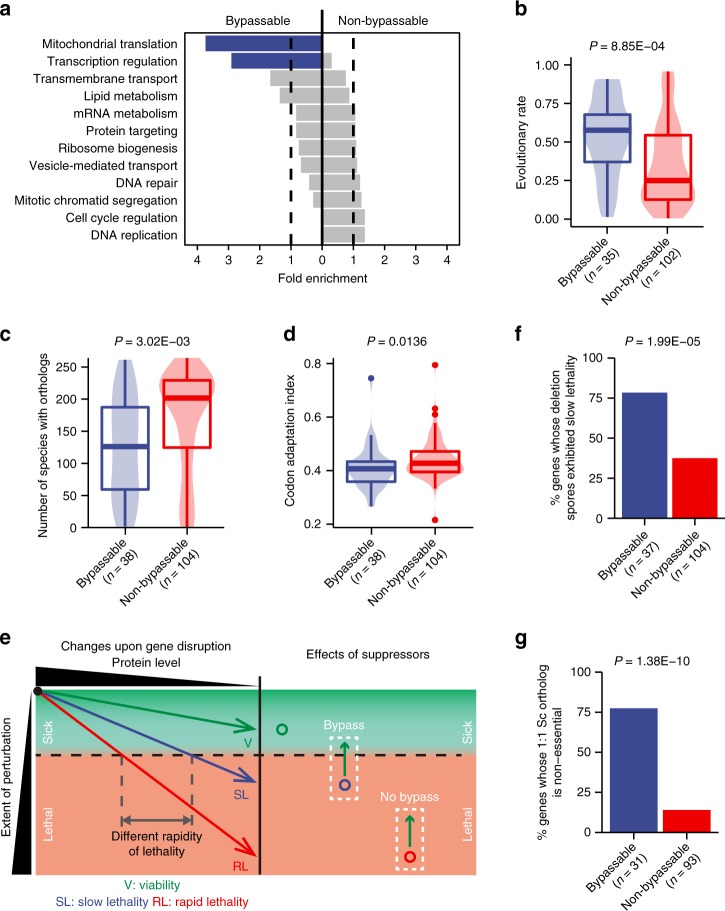
Fig. 3.
Essentiality bypass preferentially occurs to essential genes with lower importance and essential genes exhibiting differential essentiality between species. a Two GO slim terms were significantly enriched among bypassable essential genes (Fisher’s exact tests, P = 6.35E-05 and 0.00146, respectively, for the two terms at the top). b–d Evolutionary rate (b), the number of species harboring orthologs (c), and codon adaptation index (d) exhibit correlations with bypassability (Mann–Whitney–Wilcoxon tests). e A model explaining the relationships between gene importance, rapidity of lethality upon gene disruption, and bypassability. Arrowed lines in the left panel show the perturbation becoming more severe as the protein product of the disrupted gene is being depleted. For a non-essential gene (green), the perturbation extent never reaches the lethal threshold (the dashed horizontal line). For essential genes, the threshold is crossed later for a less important gene whose loss results in a weaker perturbation (blue) than for a more important gene whose loss results in a more severe perturbation (red). The former is more likely to be bypassable by ectopic suppressors than the latter (right panel). f, g Percentages of genes exhibiting slow spore lethality (f) and percentages of genes whose one-to-one S. cerevisiae ortholog is non-essential (g) (Fisher’s exact tests). Boxplots show median (centerline), interquartile range (box), and most extreme data points no further than 1.5-fold interquartile range from either end of the box (whiskers)

