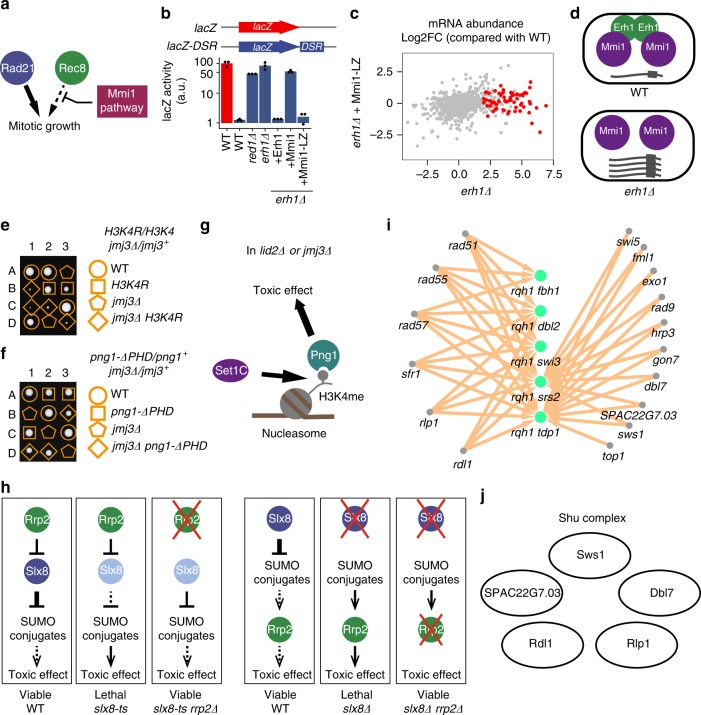
Fig. 7.
Examples demonstrating the power of BOE analysis to infer gene functions. a Schematic showing the relationships between rad21, its paralog rec8, and the Mmi1 pathway. b Mmi1 fused with a homodimeric leucine zipper (Mmi1-LZ) rescued the gene repression defect of erh1Δ. DSR-fused lacZ gene (lacZ-DSR) was used as a reporter. lacZ expressed in WT was used as a normalization control. c A scatter plot showing log2-transformed fold changes (Log2FC) of mRNA abundance relative to WT in erh1Δ and erh1Δ expressing Mmi1-LZ. mRNAs upregulated in erh1Δ are highlighted in red. d A model of how Erh1 functions. e jmj3 can be bypassed by the K4R mutation in histone H3. f jmj3 can be bypassed by the PHD domain truncation of png1. g A model depicting the Set1C-H3K4me-Png1 axis that causes the lethality of lid2Δ and jmj3Δ. h A model explaining how rrp2Δ can suppress slx8-ts (left) and a model explaining how rrp2Δ can suppress slx8Δ (right). i BOE analysis identified 16 genes (gray nodes), when individually deleted, can suppress the lethality of at least one of five synthetic-lethal double deletion mutants (green nodes). j A diagram depicting the fission yeast Shu complex, including the two subunits newly identified in this study

