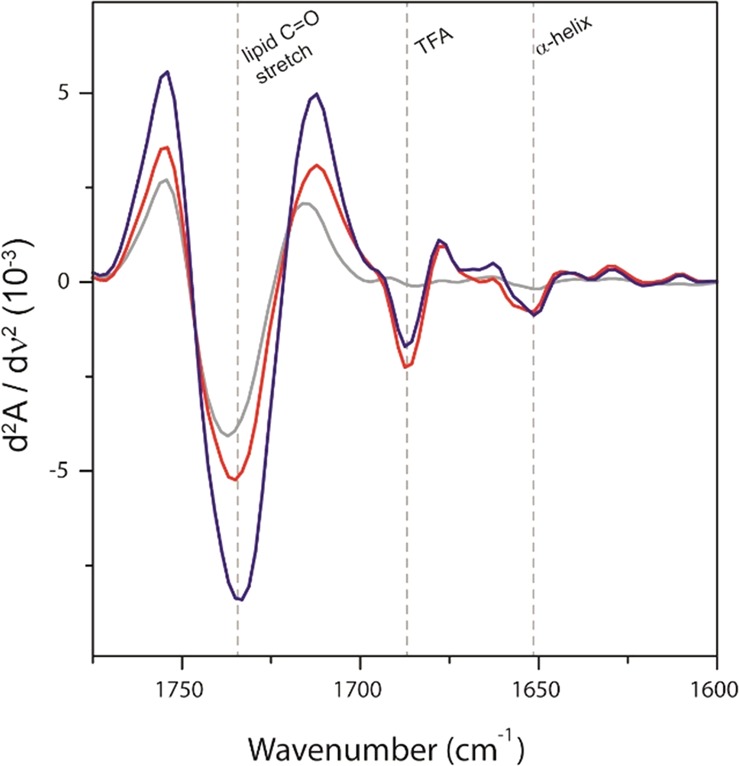
Figure 4.

Absorbance second derivative of ATR-FTIR spectra for the C = O stretch and amide I regions for liposomes in the absence (grey line) and in presence of DT-P1 (red line) and DT-P2 (blue line) peptides in dry films. Since the peptide:lipid ratio (1:130) is prone to mask peptide secondary structures, we have used the second derivative of ATR-FTIR to highlight different secondary structures due to mathematical band narrowing. The intense peak at 1685 cm−1 indicates the presence of TFA, used as counter-ion in peptide synthesis. The dotted lines indicate the wavenumber position of regions of interest.
