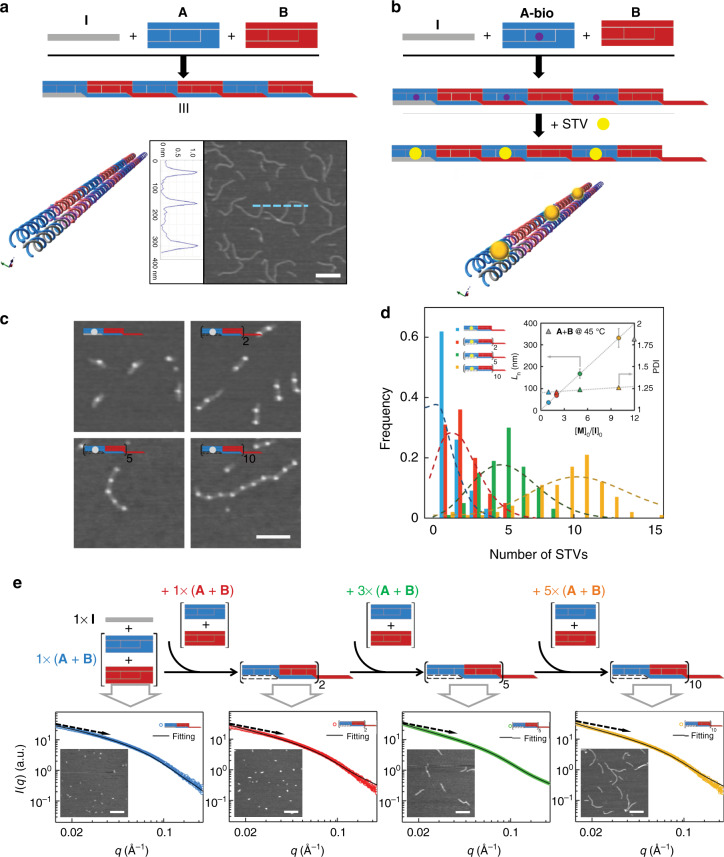
Fig. 2.
Length control and living 1D chain-growth copolymerization of DHT nanofilaments. a Schematic illustration and atomic force microscopy (AFM) image of DHT nanofilaments copolymerized at [M]0/[I]0 = 10. Scale bar: 200 nm. b Schematic illustrations of the copolymerization of A-bio, B and initiator I, and then labeling with streptavidin (STV) proteins (STVs are shown as yellow dots or balls). c AFM images of the STV-decorated DHT nanofilaments copolymerized at the ratios of [M]0/[I]0 = 1, 2, 5, and 10, respectively. Scale bar: 100 nm. d Histogram of the number of STVs that decorated the DHT nanofilaments copolymerized at individual ratios of [M]0/[I]0 = 1 (blue), 2 (red), 5 (green), and 10 (yellow). The dashed lines show Poisson fits to the histograms with the corresponding colors. Inset shows plots of average lengths (Ln, left) and PDI (right) vs. [M]0/[I]0 ratios for DHT nanofilaments and PDI of copolymer formed at 45 °C without initiator (gray triangle). Error bars represent the mean ± standard deviation. e Schematic illustration, small-angle X-ray scattering (SAXS) profiles and AFM images (inset) of living chain-growth copolymerization with the stepwise addition of new monomers into the polymerization system. Scale bar: 200 nm

