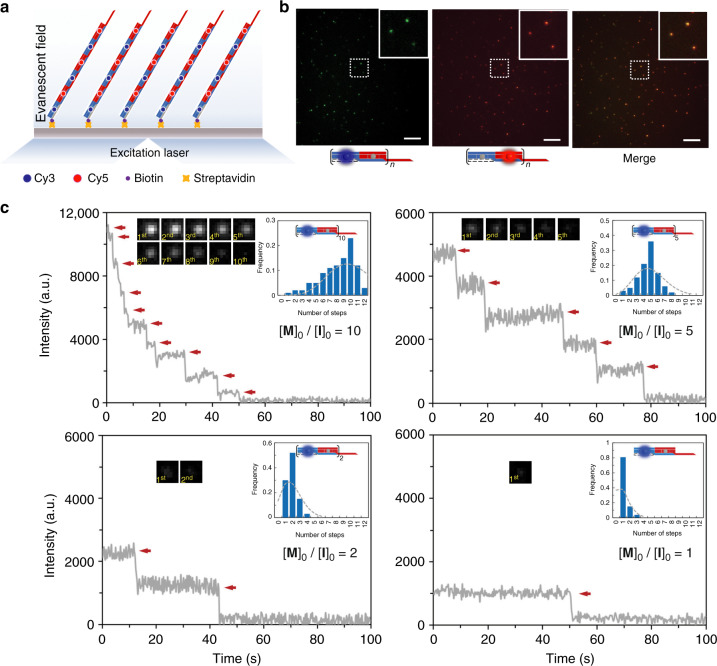
Fig. 3.
Single-molecule fluorescence imaging of copolymerization of 1D DH nanofilaments. a Schematic illustration of the fluorophore-labeled nanofilaments (copolymerized at the ratio [M]0/[I]0 = 2) imaged through total internal reflection fluorescence microscopy (TIRFM). Cy3 (blue dot) and Cy5 (red dot) are labeled in the core strands a1 and b1, respectively. b TIRFM images of surface-grafted nanofilaments acquired with the excitation of 561 nm (left) and 633 nm (middle). Overlay image (right) shows the colocalization of Cy3 (green) and Cy5 (red) labels. c Representative intensity vs time trajectories illustrating the fluorescence photobleaching of Cy3-labeled nanofilaments copolymerized with ratios of [M]0/[I]0 = 10, 5, 2, and 1, respectively (arrows indicate photobleaching events)

