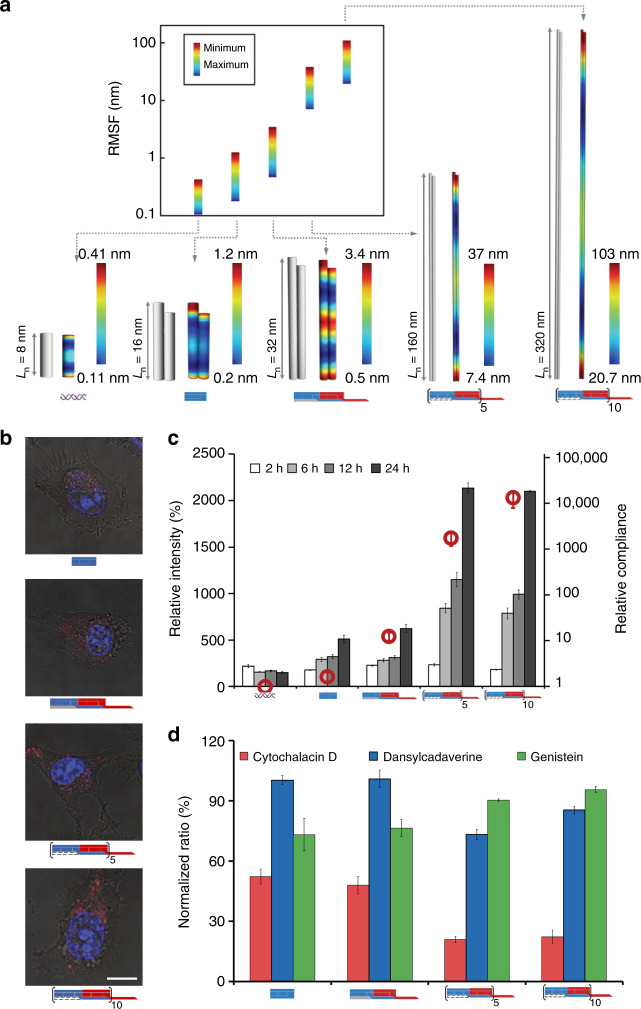
Fig. 5.
Endocytosis of 1D DHT nanofilaments in living mammalian cells. a Three-dimensional (3D) equilibrium conformation and heat map color range for root-mean-square fluctuations (RMSFs) simulated by CanDo. Blue and red color represent low and high relative flexibility, respectively. Bluest color indicates zero percentile RMSF and reddest color indicates no <95% RMSF. Insets shows plots and table of minimum and maximum RMSF values of double-stranded DNA (dsDNA), monomer A and the nanofilaments of different lengths (i.e., I-A-B, I-[A-B]5, and I-[A-B]10). b Merged confocal images of intracellular localization of Cy3-labeled DNA structures (red) under serum-free incubation condition for 12 h, with cell nuclei stained with SYTO 59 (blue). Scale bars: 10 μm. c Analysis of the dependence of cellular uptake on the structural properties and time. DNA materials (the concentration was normalized as 50 nM of labeled dyes in dsDNA, monomer A, I-A-B, I-[A-B]5, and I-[A-B]10, respectively) were incubated with A549 cells at different time intervals in the serum-free medium. Fluorescence was quantified with flow cytometry. The results are representative of three independent experiments. d Fluorescence analysis of endocytic mechanisms of DHT and DHT nanofilaments. Different endocytosis inhibitors were applied to elucidate the associated mechanisms. All error bars represent the mean ± standard deviation obtained from at least three independent experiments

