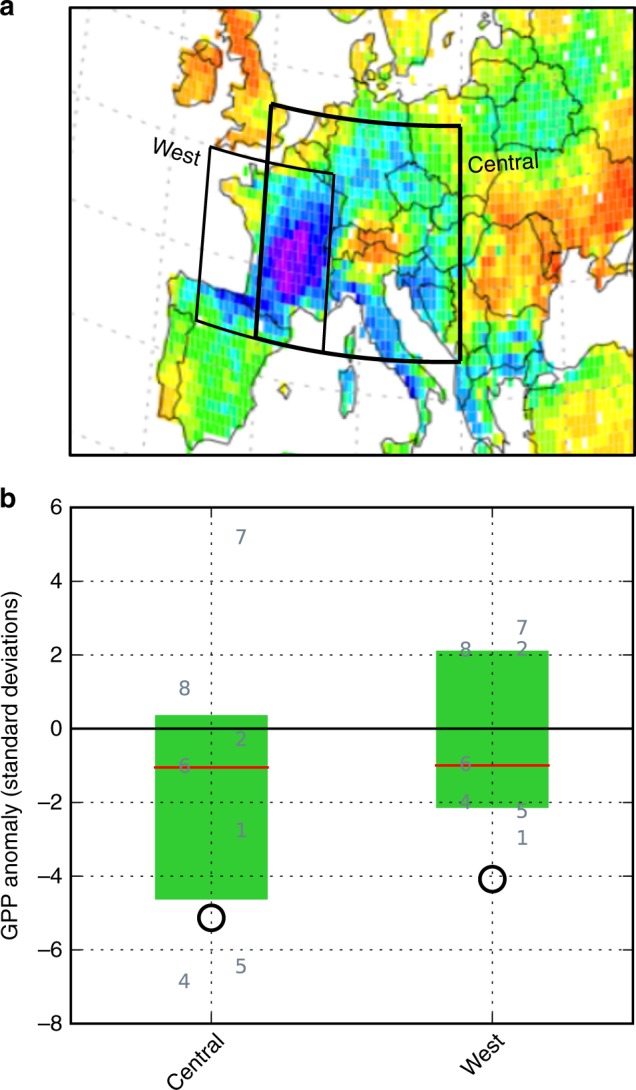
Fig. 4.

Summer (June–August) gross primary productivity (GPP) anomaly in 2003. a Outlines of the West and Central regions, overlaid on a map of the observed GPP anomaly; see Supplementary Fig. 10 for a more detailed version of this map. b Regionally averaged anomaly. Black circles show MODIS remote-sensing-derived estimates. Grey numbers are the global vegetation models; numbers offset to the left represent models that were run without considering any human influence except climate change, while numbers offset to the right represent models that accounted for historical land-use patterns and, in some cases, anthropogenic water withdrawal. Red lines indicate the median, and green boxes the interquartile range, of the model ensemble. One model (no. 4) did not report total GPP but only GPP for individual plant functional types (PFTs); for this model, we show the sum of the four dominant PFTs in the relevant region
