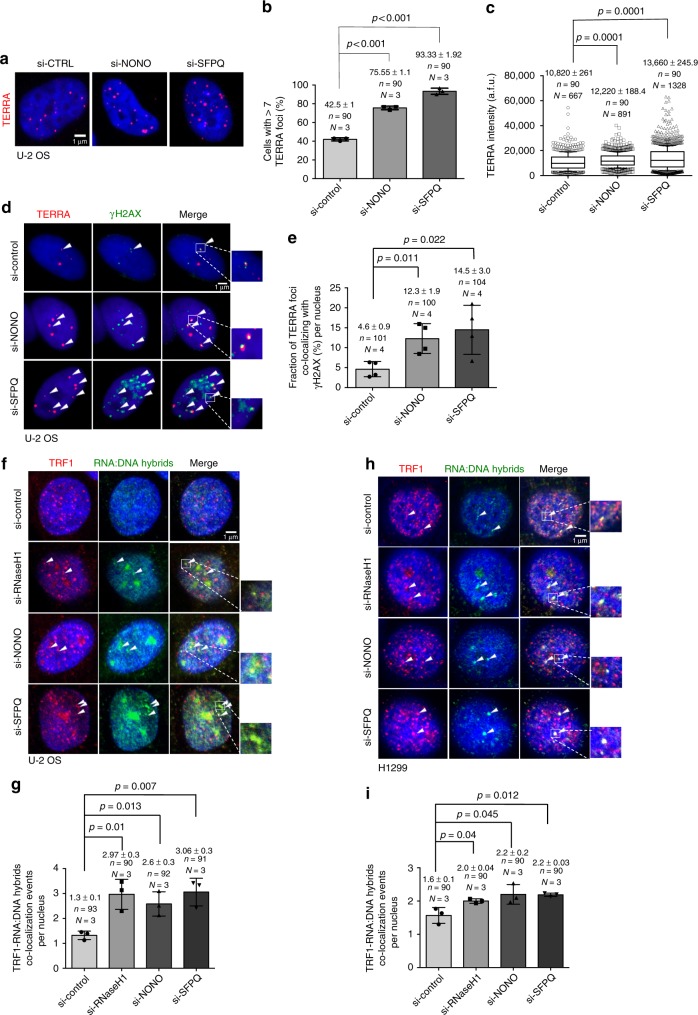
Fig. 2.
Depletion of NONO and SFPQ cause accumulation of RNA:DNA hybrids. a Representative images of TERRA RNA-FISH performed in U-2 OS cells transiently transfected with NONO- or SFPQ-specific siRNAs or with a non-targeting control siRNA. b Quantification of the percentage of cells with more than three TERRA foci per nucleus. c Quantification of TERRA signals intensity. Arbitrary fluorescence units (a.f.u.) are shown. Box plots: middle line represents median, and the box extends from the 25th to 75th percentiles. The whiskers mark the 10th and 90th percentiles. p-values were calculated using a two-tailed Mann–Whitney test. Median a.f.u. values and standard deviation are indicated; n = number of analyzed nuclei, N = number of analyzed TERRA signals. d Representative images of TERRA RNA-FISH combined with anti-γH2AX immunostaing performed in U-2 OS cells transfected with indicated siRNAs. Arrowheads indicate co-localization events. e Quantification of d; percentage of TERRA foci co-localizing with γH2AX per nucleus is indicated. f, h Representative confocal microscope images of combined immunofluorescence using S9.6 anti-RNA:DNA hybrid and anti-TRF1 antibodies in U-2 OS (f) or H1299 (h) cells transfected with indicated siRNAs. Arrowheads indicate co-localization events. g, i Quantification of telomeric RNA:DNA hybrids per nucleus in U-2 OS (i) or H1299 (h) cells. For quantifications in b, e, g, i mean values are indicated; error bars indicate standard deviation; N = number of independent experiments. n = number of analyzed nuclei. A two-tailed Student’s t-test was used to calculate statistical significance; p-values are shown. Source data is provided as a Supplementary Information File. Scale bar, 1 μm. siRNAs listed in Supplementary Table 1

