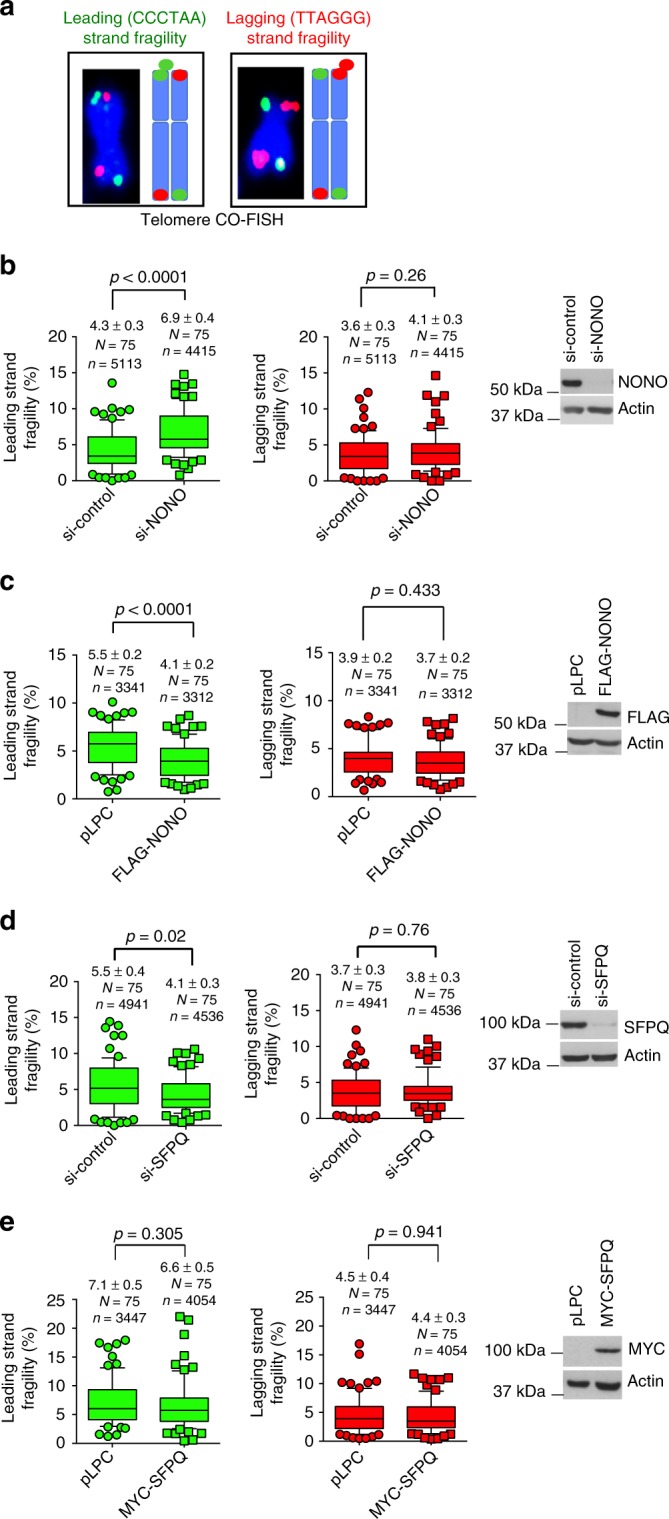
Fig. 4.

NONO and SFPQ regulate telomeric leading strand fragility of U-2 OS cells. a Representative images and explanative models of leading strand and lagging strand telomeric fragility as detected by Chromosome Orientation FISH (CO-FISH). Fragile telomeres appear as multiple telomere signals. b Quantification of leading strand fragility (left panel) and lagging strand fragility (central panel) in U-2 OS cells transfected with NONO-specific siRNA or a non-targeting control siRNA. Right panel, western blotting showing NONO knockdown efficiency. c Quantification of leading strand fragility (left panel) and lagging strand fragility (central panel) in U-2 OS cells that stably overexpress FLAG-NONO or a control vector. Right panel, western blotting showing ectopic expression of FLAG-tagged NONO. d Quantification of leading strand fragility (left panel) and lagging strand fragility (central panel) in U-2 OS cells transfected with SFPQ-specific siRNA or a non-targeting control siRNA. Right panel, western blotting showing SFPQ knockdown efficiency. e Quantification of leading strand fragility (left panel) and lagging strand fragility (central panel) in U-2 OS cells that stably overexpress myc-tagged SFPQ or an empty vector. Right panel, western blotting showing expression of ectopic myc-SFPQ. For quantifications in b–e, data points represent the percentage of fragile telomeres per metaphase spread. Only chromosome ends with detectable telomeres were considered for analysis. Metaphases from three independent experiments were analyzed. Box plot diagrams (b–e): middle line represents median; boxes extend from the 25th to 75th percentiles. The whiskers mark the 10th and 90th percentiles. p-values were calculated using a two-tailed Mann–Whitney test. Median fragility values and standard deviation are indicated; n = number of analyzed telomere repeat signals, N = number of analyzed metaphase spreads. siRNAs listed in Supplementary Table 1. Source blots are available in Supplementary Figure 8
