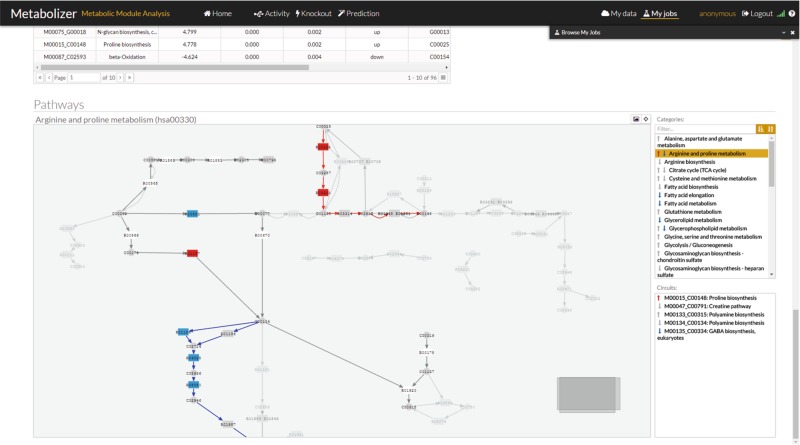
Fig. 1.
Metabolizer graphic interface with a representation of the modules. On the right side there is a list of KEGG pathways with arrows up or down in case they contain modules with up or down activations, respectively. When the arrow is gray, the change in activity is not significant. Red up arrows indicates a significant increase in activity and blue down arrow a significant decrease of activity in the module. Below the pathway list, there is another list with the modules within the pathway with the same code for arrows

