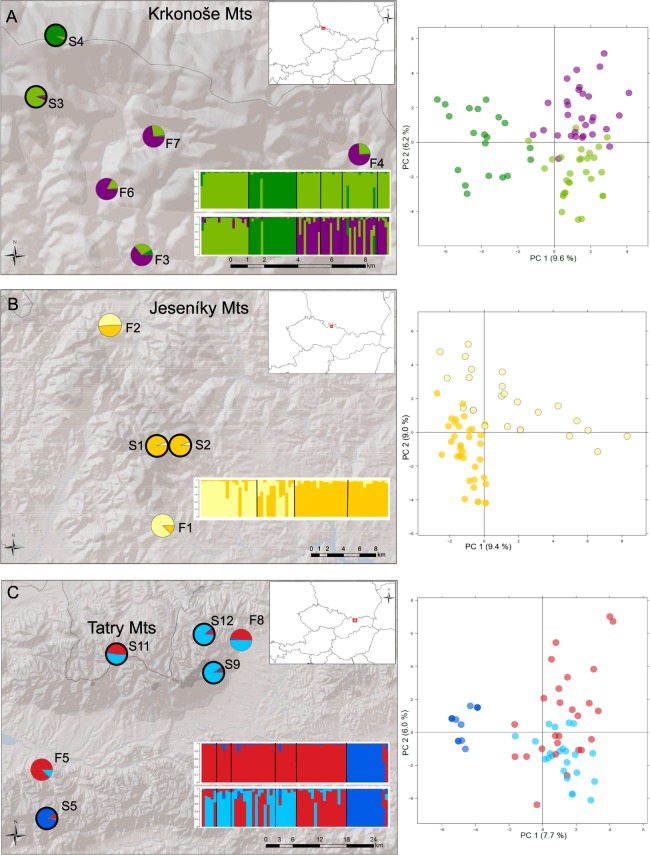
Figure 2.
Genetic sub-structuring of P. elatior populations in each target mountain range. Pie charts and barplots show the proportional assignment of individuals from each population to clusters inferred by a separate structure analysis of (A) the Krkonoše (79 individuals), (B) the Jeseníky (60 individuals), and (C) the Tatry (63 individuals); accompanied by principal component analysis (PCA) of individuals. Subalpine populations are denoted by bold circles. Maps were processed in ArcMap version 10.0 (http://desktop.arcgis.com/en/arcmap/) by V. Konečná, map layers were modified (http://desktop.arcgis.com/en/arcmap/10.3/manage-data/raster-and-images/hillshade-function.htm) by V. Konečná.

