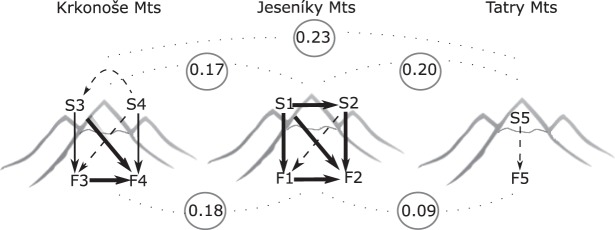
Figure 3.
Migration and differentiation of foothill (F) and subalpine (S) populations of P. elatior in the three mountain ranges of central Europe. The values between mountain ranges are overall mean pairwise FST between foothill and subalpine populations. The arrows indicate preferred migration scenario, their width reflects estimated number of immigrants per generation (Nm): dashed arrow (5–21), standard arrow (68–73), and thick arrow (161–551). Created by V. Konečná.

