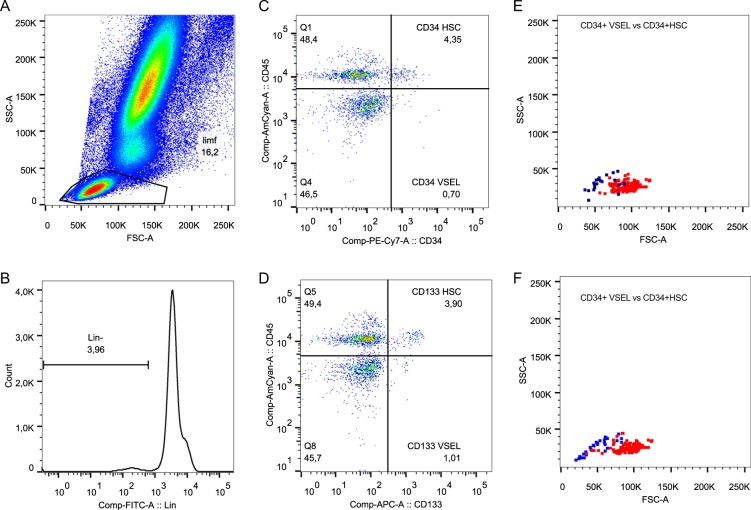
Figure 1.
Representative gating strategy for the analysis of VSELs and HSCs. (A) First, an extended lymphocyte gate was created, (B) then cells negative for the Lineage cocktail antigens are gated. (C) Lin- cells were then analyzed for the expression of CD45 and CD34 and (D) CD45 and CD133. (E) Lin-CD34+CD45+ HSCs and Lin-CD34+CD45− VSELs were then plotted on the SSC/FSC dot plot to compare their granularity and size. (F) SSC/FSC dot plot graph showing Lin-CD133+CD45− VSELs and Lin-CD133+CD45+ HSCs.

