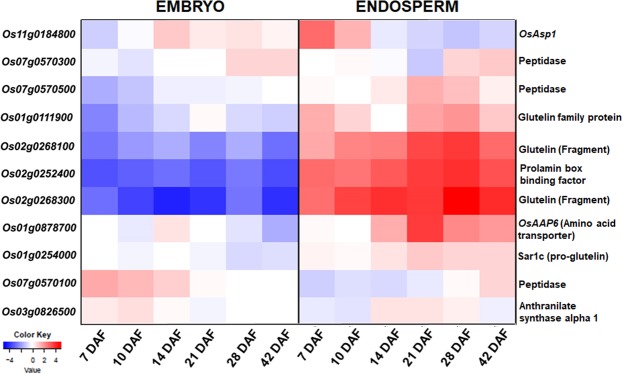
Figure 8.
The Heat map depicting expression profiles of selected 11 genes in embryonic and endosperm-specific tissues at 7-, 10-, 14-, 21-, 28- and 42- days after flowering (DAF), respectively. (Note: The X-axis represents source and collection-time the sample used to generate the expression data while the Y-axis represents hierarchical clustering pattern. Selected 11 genes to generate the heat map are mentioned as per their RAP-ID).

