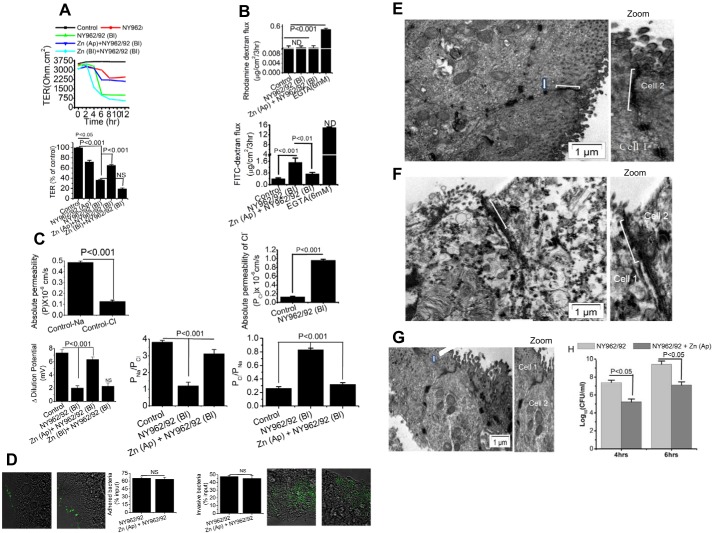
Fig. 1.
Apical Zn2+ application rescue severely affected paracellular transport function of Shigella infection in T84 cells. T84 cell monolayers used were grown 10 days postconfluence on transwell plates (Control). Infected monolayers were treated with 200 multiplicity of infection Shigella flexneri 2a (NY962/92) to either mucosal (Ap) or serosal (Bl) medium and in presence or absence of Zn2+ (200 μM). A: transepithelial electrical resistance (TER) quantification was derived from time course study when resistance reached a stable value of >500 Ohm·cm2. Top: representative time course of TER in response to Shigella infection and in presence of Zn2+. B: paracellular permeability of dextran across T84 monolayers. Shigella infection increased 4-kDa FITC-dextran flux (bottom) but not the 70-kDa rhodamine-dextran (top). Mucosal Zn2+ reversed Shigella-induced FITC-dextran flux. C, bottom: dilution potentials for Na+ and Cl− were measured on T84 cell monolayers infected with S. flexneri 2a in presence and absence of Zn2+. Permeability of Na+ over Cl− (PNa/PCl) and permeability of Cl− over Na+ (PCl/PNa) ratios were calculated as described in materials and methods. Top left: absolute permeability of Na+ and Cl− in uninfected (Control) T84 monolayers. Top right: absolute permebility of Cl− in uninfected (Control) and Shigella (NY962/92)-infected T84 monolayers. D: effect of Zn2+ on Shigella adhesion (left) and invasion (right) with visualization of bacteria labeled with green fluorescent protein (GFP) variant in infected T84 cells. Bar graph indicates that both adhesion and invasion of Shigella are similar in presence or absence of Zn2+ in T84 cell monolayers. Data are means ± SE; n = 5–6 independent experiments. NS, not significant. E and F: effects of Zn2+ on ultrastructure micrograph of tight junctions (TJ). T84 cells were treated with Zn2+ in presence of Shigella infection for 4 h and processed for transmission electron microscopy (TEM) as described in materials and methods. E: Control (uninfected) cells are oriented in such a way that the bottom right hand is apical and the top left is more basal. Bracket points toward a TJ that shows close apposition of plasma membrane leaflets of 2 cells. Arrow points to a desmosome with dense desmosomal plaques seen on either side of the intercellular space. F: TJ indicates location of discontinuous TJ zone with few membrane fusions, along with widening of gap between the 2 membranes due to Shigella infection. G: Zn2+ application brought about close membrane apposition with no apparent breakdown of intracellular membrane junction. Zoomed images depict detail in apical membrane TJ with altered regions indicated by brackets; n = 4 independent experiments. H: apical-to-basolateral bacterial translocation assay was performed with polarized T84 cells for 4 and 6 h. Basolateral medium was collected after 4 and 6 h and plated to obtain bacterial counts. Data plotted are means ± SE; n = 4–6 independent experiments.

