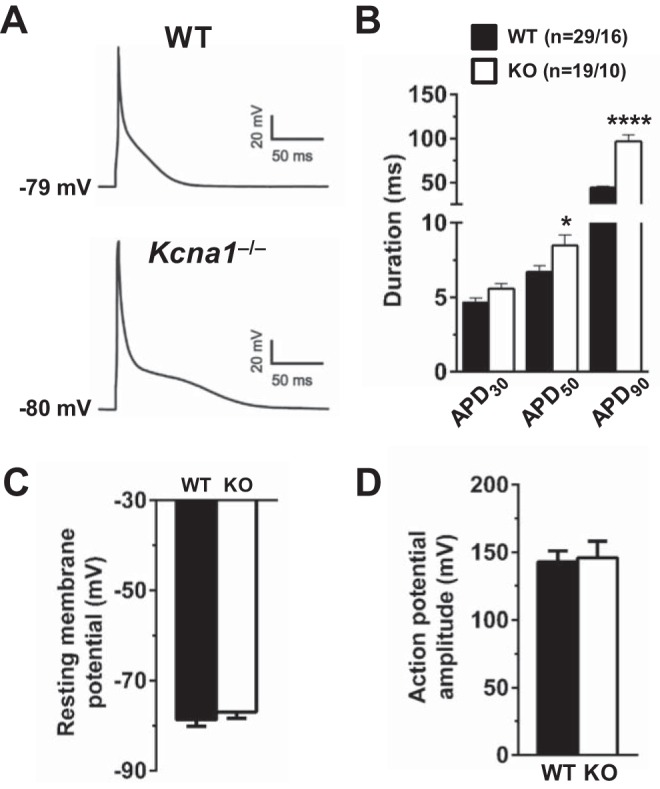
Fig. 3.

Kcna1−/− atrial myocytes exhibit action potential duration (APD) prolongation. A: representative atrial action potentials recorded in a wild-type (WT) cell and a Kcna1−/− cell. The resting membrane potential is indicated next to each waveform. B: average APD in WT and Kcna1−/− cells at 30, 50, and 90% repolarization (APD30, APD50, and APD90). C and D: average resting membrane potential (C) and action potential amplitude (D) in WT (n = 29/16) and Kcna1−/− cells (n = 19/10). Sample numbers (n) indicate myocytes per mouse. *P ≤ 0.05; ****P ≤ 0.0001 (2-tailed unpaired Student’s t-test). KO, knockout.
