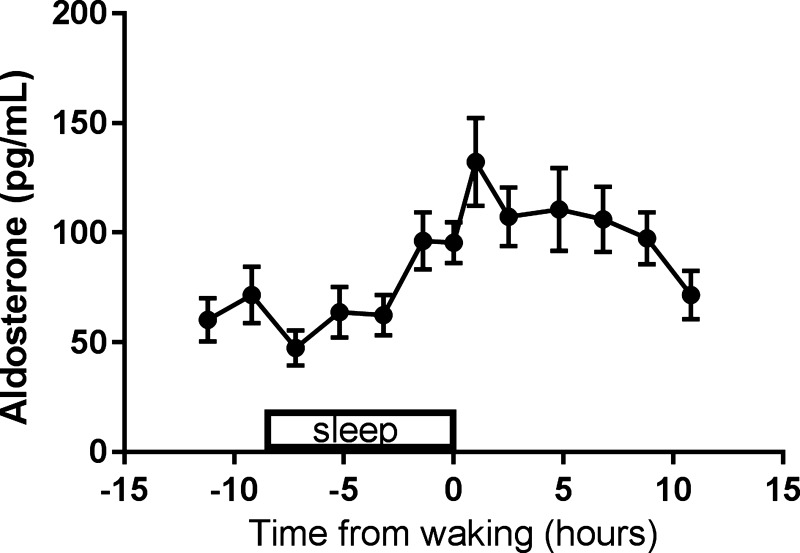
Fig. 2.
Baseline profile of aldosterone from the circadian study. The baseline profile from the circadian study shows a trough in aldosterone during sleep and a peak in the morning upon awakening. Data were standardized to each participant’s time of sleep and then averaged. Data are plotted as means ± SE.

