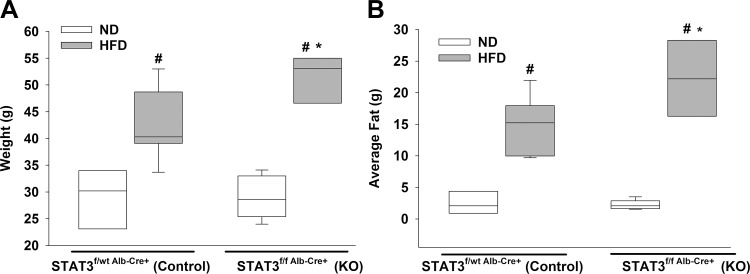
Fig. 7.
Effects of high-fat diet (HFD) feeding on hepatic signal transducer and activator of transcription 3 knockout (H-STAT3 KO) mice. Weight (A) and fat mass (B) of KO (STAT3f/f Alb-Cre+) and littermate controls (STAT3f/wt Alb-Cre+) were measured by EchoMRI at the conclusion of dietary intervention. Vertical box represents 25th percentile (bottom line), median (middle line), and 75th percentile (top line) values; whiskers represent 10th and 90th percentiles. White box, normal diet ND); gray box, HFD. Data were analyzed by two-way ANOVA (n = 3–7/group). *P ≤ 0.05 vs. control within diet; #P ≤ 0.05 vs. ND within genotype.

