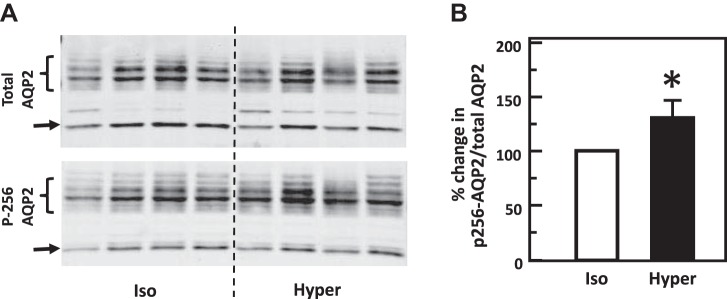
Fig. 4.
Hypertonicity increased phosphorylation of aquaporin-2 (AQP2) at serine 256 in rat inner medulla (IM). A: representative Western blot showing AQP2 abundance and phosphorylated AQP2 in rat IM with hypertonic (Hyper) stimulation (690 mosmol/kgH2O) for 15 min. Brackets indicate AQP2 glycosylated protein between 35 and 45 kDa and arrows indicate unglycosylated protein at 29 kDa. Samples from a different rat were loaded into each lane. B: bar graph showing the ratio of the band densities of phosphorylated AQP2 to total AQP2 abundance. Bars = means ± SE. *P < 0.05 vs. isotonic (Iso) treatment (290 mosmol/kgH2O); n = 4 rats/condition.

