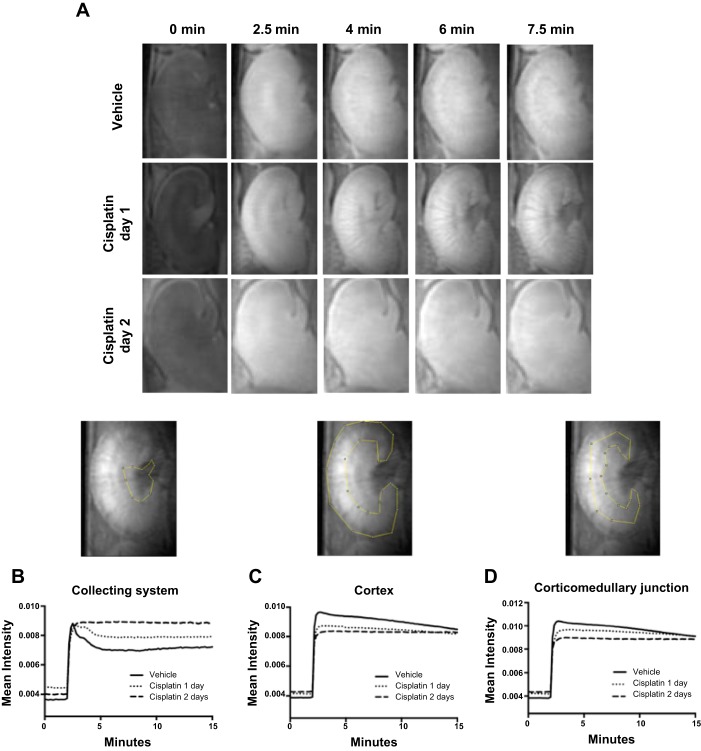
Fig. 4.
Visualization of time vs. contrast intensity changes in regions of the kidney following cisplatin. Mice were injected with vehicle or cisplatin (30 mg/kg). At 1 or 2 days following cisplatin, mice were injected with gadolinium contrast and imaged with a magnetic resonance imaging (MRI) scanner. A: still frame images at the indicated time points for each treatment group. B–D: time vs. contrast intensity profile for the collecting system (B), cortex (C), and corticomedullary junction (D). Image above graph displays representative gate used to identify the region of interest. Graph displays mean of intensity readings for all animals in each group (n = 5 for vehicle and cisplatin day 1 mice, n = 4 for cisplatin day 2 mice).

