Fig. 5.
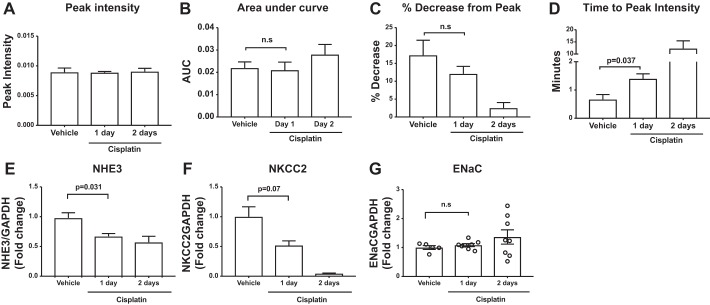
The time to peak contrast intensity in the collecting system is prolonged following cisplatin, which is correlated with reduced gene expression of upstream nephron transporters. Mice were injected with vehicle or cisplatin (30 mg/kg). At 1 or 2 days following cisplatin, mice were injected with gadolinium contrast and imaged with a magnetic resonance imaging (MRI) scanner. The following parameters were measured: peak contrast intensity (A), area under the curve (AUC, B), %decrease from peak contrast intensity to the end of measurement (C), and time to peak contrast intensity (D) (n = 5/group). E–G: in kidney tissues from mice above and additional mice, RT-PCR was performed for mRNA encoding Na+/H+ exchanger (NHE3, E), Na+-K+-Cl− cotransporter (NKCC2, F), and β-ENaC (G) (n = 5 for vehicle-treated mice; n = 8 for cisplatin day 1 and day 2 mice). Data are expressed as means ± SE. Significance was determined by Welch’s ANOVA with Dunnett posttest for multiple comparisons with the vehicle-treated group.

