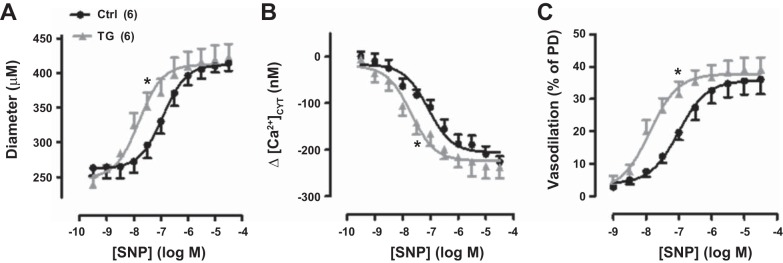
Fig. 12.
Sodium nitroprusside (SNP) cumulative dose-response curves for exposed femoral arteries in control (Ctrl) and transgenic (TG) mice in vivo; SNP was applied by superfusion. A: SNP dose versus artery diameter. Ctrl passive diameter (PD) = 407 ± 23 μm (n = 6); TG PD = 387 ± 13 μm (n = 6). B: SNP-induced decrease (Δ) in cytosolic Ca2+ concentration ([Ca2+]CYT). Basal [Ca2+]CYT was 219 ± 31 nM in Ctrl mouse arteries and 309 ± 27 nM in TG mouse arteries. C: SNP-induced vasodilation (as %PD). TG curves were all significantly shifted to the left (indicating higher affinity and lower SNP EC50 values) relative to the respective Ctrl curves (*P < 0.05). Values are means ± SE. Statistics were by two-way ANOVA. Numbers of mice are in parentheses.

