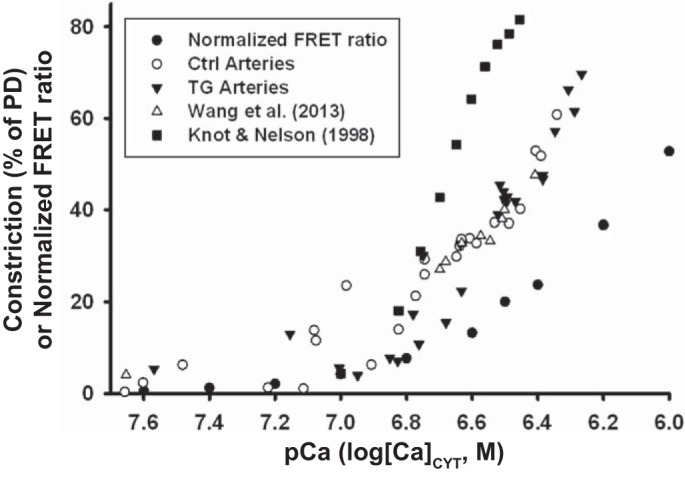
Fig. 13.

Femoral artery constriction [%passive diameter (PD)] in vivo graphed as a function of pCa (−log[Ca2+]CYT; cytosolic Ca2+ concentration). Data were taken from Figs. 2–12 [○, control (Ctrl); ▼, transgenic (TG)] and from Wang et al. (58) (Δ). The regression lines for the three sets of data for [Ca2+]CYT = 100–500 nM (R = 0.91, 0.69 and, 0.97, respectively) were indistinguishable and correspond to a constriction of ~10% of PD per 100 nM increase in [Ca2+]CYT. For comparison, the myogenic constriction versus pCa data in isolated, pressurized (60 mmHg) rat small posterior cerebral arteries taken from Fig. 10 of Knot and Nelson (29) are also shown (■); the constriction, as %PD, was calculated based on a PD of 210 μm. The graph also contains the normalized exogenous myosin light chain kinase transgene Förster resonance energy transfer (FRET) ratio curve (●; where 0 = “0” [Ca2+]CYT; 100 = saturating [Ca2+]CYT) from Fig. 1B of Wang et al. (58).
