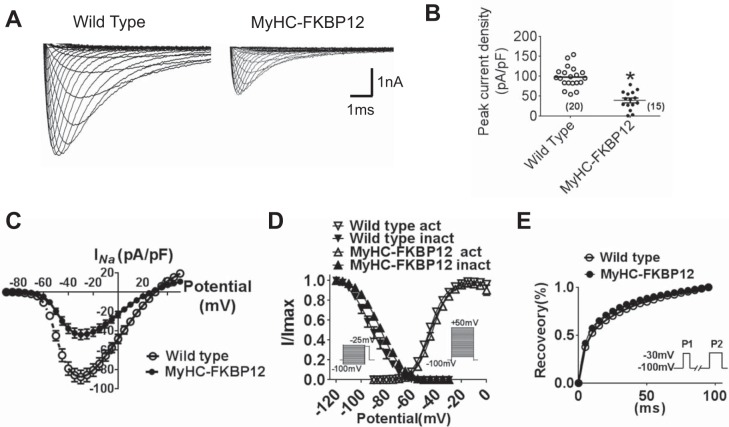
Fig. 4.
Analysis of Na+ currents (INa) of isolated atrial cardiomyocytes in nontransgenic (NTG) and FK506-binding protein 12 transgenic (αMyHC-FKBP12) mice. A: representative tracings of total INa. B: peak INa density from NTG (n = 20 cells/4 mice) and αMyHC-FKBP12 (n = 15 cells/4 mice) atrial myocytes. C: current-voltage (I-V) relationship (I-V curve) for peak INa density. D: voltage dependence of the steady-state activation and inactivation for INa. For activation, the cell was held at −100 mV and depolarized for 50 ms to potentials between −90 and +10 mV in 5-mV increments. The interpulse interval was 1 s. For inactivation, the cell was held at −100 mV, and 1-s preconditioning pulses to potentials between −120 and −30 mV in 5-mV increments were applied followed by 40-ms test pulses to −25 mV. The interpulse interval was 3 s. E: time course of INa recovery from inactivation. Recovery was recorded by depolarizing the cell to −30 mV from the holding potential of −100 mV for 300 ms (P1) followed by a variable recovery interval and a subsequent −30-mV test pulse (P2). *P < 0.05 vs. NTG mice.

