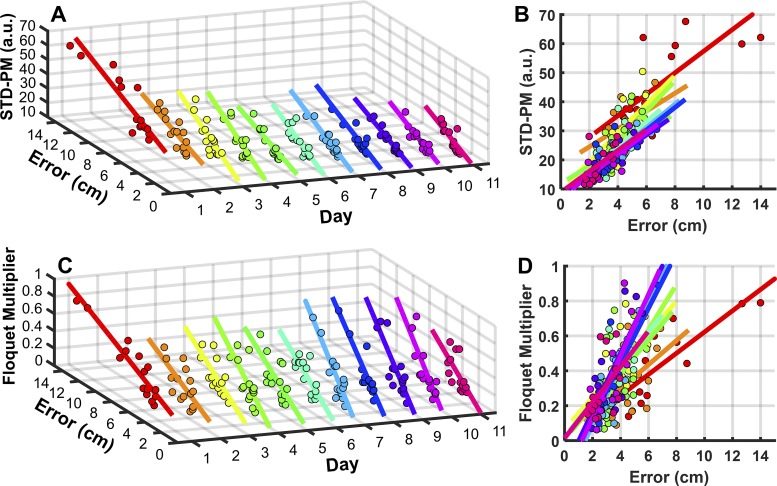
Fig. 8.
Correlation between variability and stability measures and performance. A: correlation between variability, defined as the standard deviations of the Poincaré map (STD-PM), and performance error for each day. The lines represent the correlations across subjects for each day. B: same correlations plotted in 2D to highlight the changing slopes across days. C: correlation between Floquet multiplier and performance error for each day. The lines represent the correlation across subjects for each day. D: same correlations plotted in 2D to highlight the changing slopes across days.

