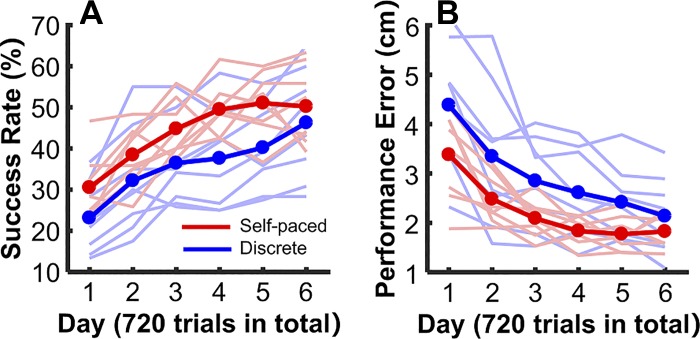
Fig. 9.
Task performance in experiment 2. The blue and red lines represent the subject means of the discrete group and the self-paced groups, respectively. The light blue and light red lines show the individual subjects’ performance in the 2 experimental groups. A: success rate across 6 days of practice. B: performance error across 6 days of practice.

