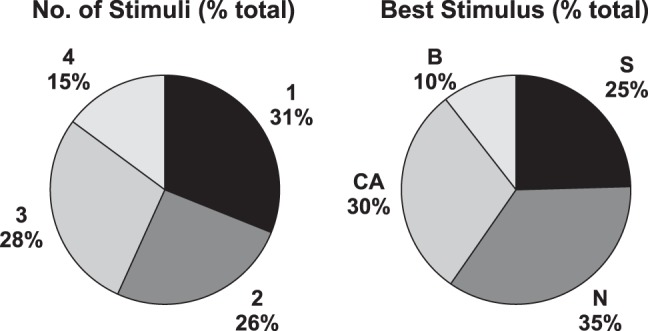
Fig. 2.

Taste tuning of nucleus of the solitary tract (NTS) cells (n = 70). Left: proportion of cells that responded to 1–4 of the taste stimuli presented. Right: proportion of cells that responded best (either increase or decrease) to each of the tastants presented. B, bitter (either quinine or caffeine); CA, citric acid; N, NaCl; S, sucrose.
