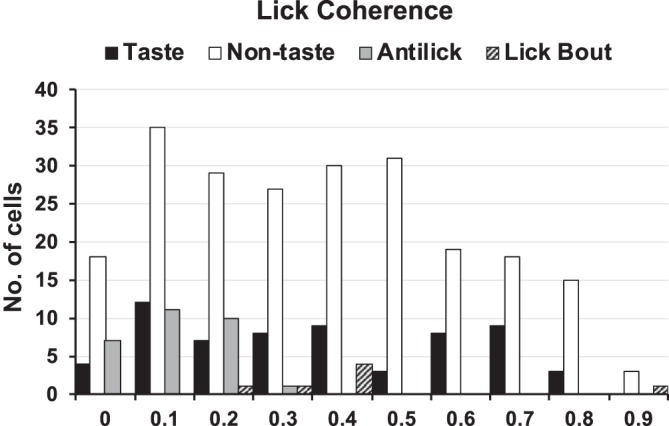
Fig. 6.

Distribution of lick coherence values in the various cell groups recorded in the nucleus of the solitary tract (NTS). Taste and nontaste cells show overlapping distribution of lick coherence; anti-lick cells show relatively low lick coherence values.
