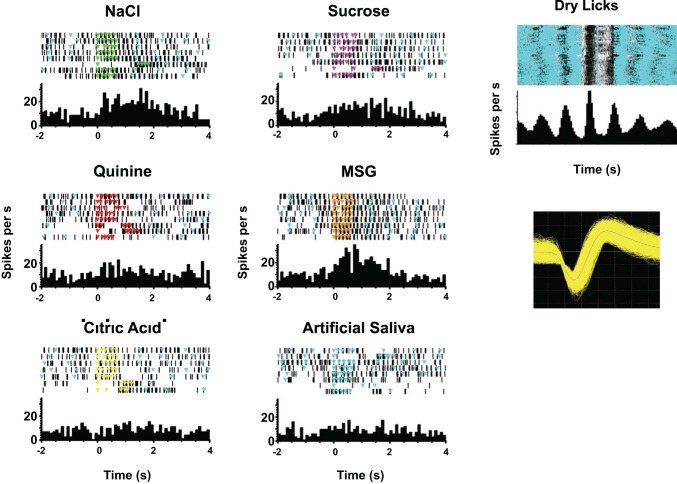
Fig. 7.
Example of a taste-responsive cell with strong lick-related properties. Left: responses to each tastant and artificial saliva. Each panel shows a raster plot (top) of cellular activity with colored triangles indicating licks (light blue triangles always indicate artificial saliva licks; occurrence of dry licks is not shown) and the associated peristimulus time histogram (bottom). Right: activity time-locked to dry (unreinforced) licks (top) and a waveform of the recorded cell (bottom). MSG, monosodium glutamate.

