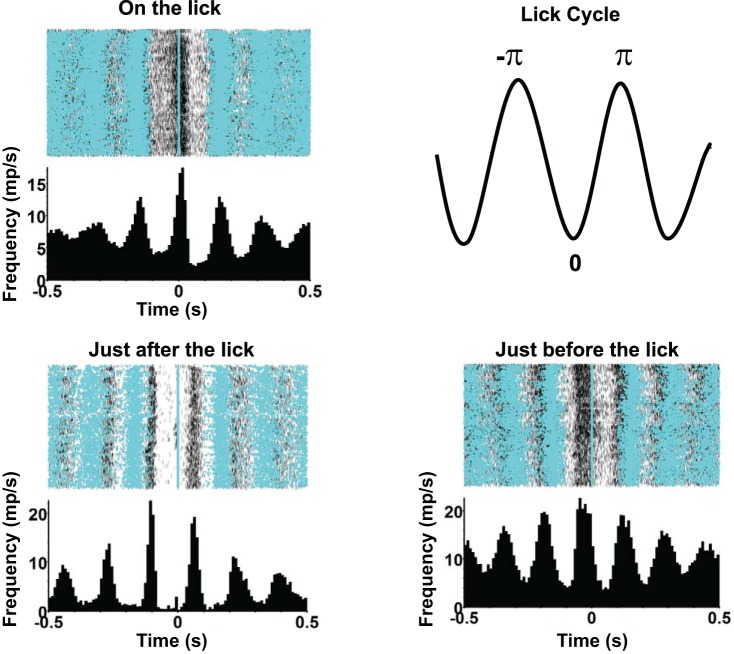
Fig. 8.
Examples of cells with peak firing rates at different phases of the lick cycle. Top right: a depiction of how the lick phase angle was measured, where 0 signifies the midpoint of the time between licks and ±π signifies the time of the lick preceding or following the trough in the cycle. None of the cells shown were taste responsive.

