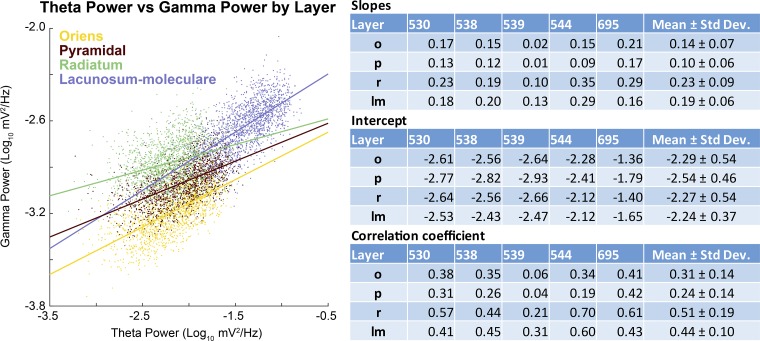
Fig. 5.
Correlation of theta power to gamma power. Left: scatter plot and least-squared regression lines for theta and gamma power across the layers of rat 695. Note that there is a clear positive trend across all layers, although it is strongest in the lacunosum-moleculare. Right: table containing the individual rat data (slope, intercept, and correlation coefficient) by layer (o, oriens; p, pyramidal layer; r, radiatum; lm, lacunosum-moleculare), as well as averages (means ± SD).

