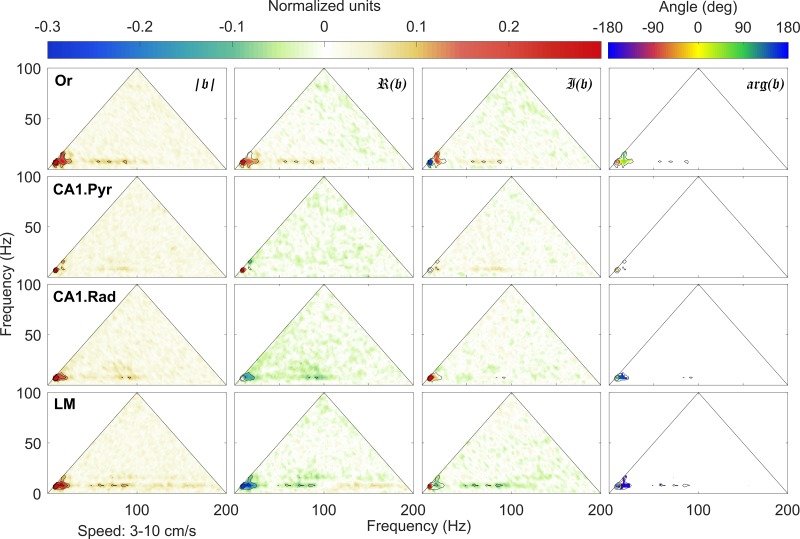
Fig. 8.
Normalized bispectrum at low speeds (3 cm/s < 𝑣 < 10 cm/s). An in-depth explanation of the bicoherence plot can be found in Sheremet et al. (2016). Briefly, the triangular region represents the area containing nonredundant information for the discrete Fourier transform. Columns (left to right) show the bicoherence |𝔟|, the real ℜ(𝔟) (skewness) and imaginary 𝔍(𝔟) (asymmetry) parts of the normalized bispectrum 𝔟, and the biphase arg(𝔟). The first three can be interpreted as nonlinearity strength and measures of the contribution of different triads to the skewness and asymmetry of the local field potential (LFP), respectively. Peak in the bispectral estimate represents a phase-coupled triplet (f1, f2, f1 + f2), where fj, j = 1, 2 are frequency bands in the Fourier representation. The observations in each row correspond to a given hippocampal layer. For each layer, black contours mark the significant bicoherence value of 0.1 (with 300 degrees of freedom, zero-mean bicoherence is <0.1 at 95% confidence level). Or, oriens; CA1.Pyr, pyramidal layer; CA1.Rad, radiatum; LM, lacunosum-moleculare.

