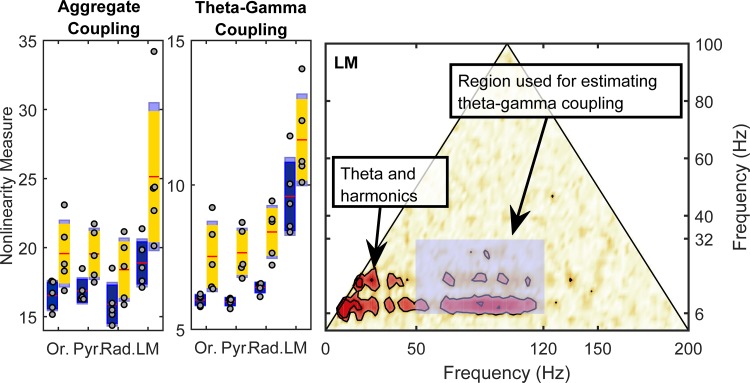
Fig. 10.
Estimate of nonlinear cross-frequency phase coupling. Left: total overall strength of nonlinearity, estimated by summing the bicoherence over its entire definition domain. Estimates are shown for speed bins at 5–15 cm/s (blue) and >35cm/s (yellow). Middle: strength of nonlinear coupling between theta (and harmonics) and gamma rhythms, estimated by summing the bicoherence values in the shaded rectangle of panel at right. The lacunosum-moleculare (LM) exhibits a significantly larger coupling strength compared with the other layers. Both total (aggregate) and strictly theta-gamma coupling strength show significant variability as a function of rat speed and hippocampal layer. Note that the y-axis differs between nonlinearity measures to optimize for display of the theta-gamma-gamma nonlinearity. Red line is the mean, dark blue or yellow is 1.96 of the SE, and light blue denotes the boundaries of 1 SD. Right: region used for estimating the strength of theta-gamma coupling is a rectangle covering the intervals [6 Hz, 32 Hz] for theta and [50 Hz, 120 Hz] for gamma.

