
Fig. 2.
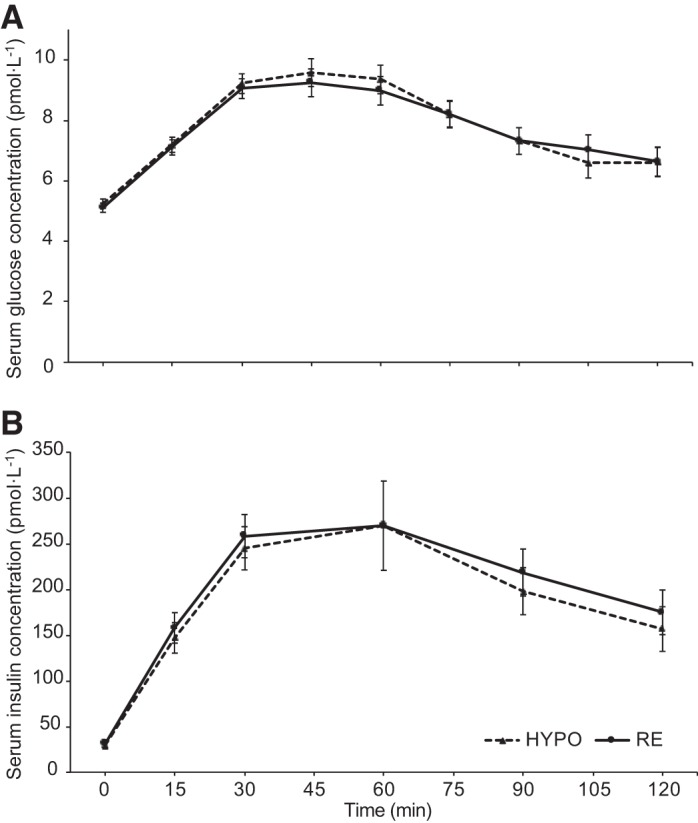
Serum glucose (A; trial F = 0.246, P = 0.627; time F = 41.128, P < 0.001; trial × time F = 0.944, P = 0.430) and insulin (B; trial F = 1.800, P = 0.200; time F = 29.597, P < 0.001; trial × time F = 0.232, P = 0.859) responses to a 75-g oral glucose tolerance test (n = 16). Data are means and normalized 95% confidence intervals. HYPO, hypohydrated trial arm; RE, rehydrated trial arm.