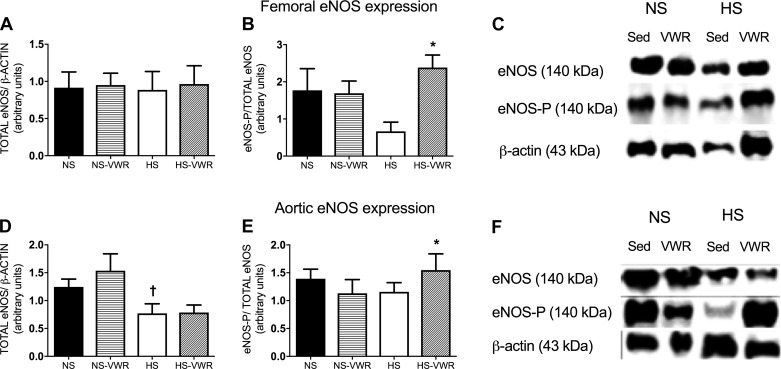
Fig. 3.
A–C: total endothelial nitric oxide synthase (eNOS) protein expression in the femoral artery normalized to β-actin (A), phosphorylated eNOS (eNOS-P, ser1177) relative to total eNOS (B), and representative Western blots (C). D–F: total eNOS protein expression in the aorta normalized to β-actin (D), eNOS-P (ser1177) relative to total eNOS (E), and representative Western blots (F). Values are means ± SE; n = 9 or 10 per group. Data analysis was performed with a 1-way ANOVA with a Tukey’s post hoc test. HS, high salt; NS, normal salt; Sed, sedentary; VWR, voluntary wheel running. *vs. HS, †vs. NS-VWR (P < 0.05).

