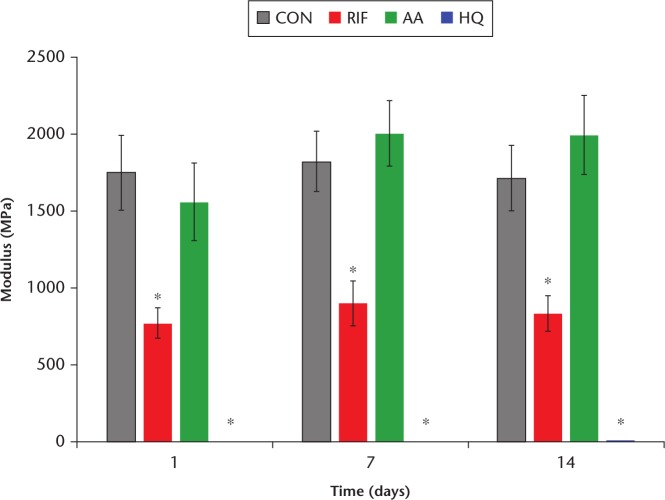
Fig. 4.
Chart summarizing the compressive modulus values. An asterisk (*) denotes a significant difference from control, p < 0.05. Ten specimens were tested from each group. CON, negative control without any additive; RIF, loaded with 1 g of rifampin; AA, positive control loaded with ascorbic acid; HQ, positive control loaded with hydroquinone.

